The Geography of Buzz

2008-2009
Project Leads
Elizabeth Currid
Sarah Williams
Exhibit + Map Design
Sarah Williams
Minna Ninova
Support from
The Haynes Foundation
Special Thanks to
Elizabeth Barry
Brian Brush
Shauna Dillavou
Aja Maria Hazelhoff
Leah Meisterlin
Gilad Ravid
Project Leads
Elizabeth Currid
Sarah Williams
Exhibit + Map Design
Sarah Williams
Minna Ninova
Support from
The Haynes Foundation
Special Thanks to
Elizabeth Barry
Brian Brush
Shauna Dillavou
Aja Maria Hazelhoff
Leah Meisterlin
Gilad Ravid
Overview
Research argues that the arts economy helps make cities more dynamic places, as the industry both supports and is supported by other advanced service sectors in the city. This reciprocity helps establish rich cultural environments that benefit all industrial sectors. While this argument has been made largely through ethnographic studies and interviews, attempts to spatially analyze these dynamics have been limited by data scale and to certain areas of the industry production chain (e.g. firm location and worker residence). This is because much of the arts and culture industry data available establishes where goods are produced, rather than informal spaces where much of the industry transactions actually occur. It is these social settings, where the arts industry rubs up against its colleagues and patrons, that set the economic pace of the industry.
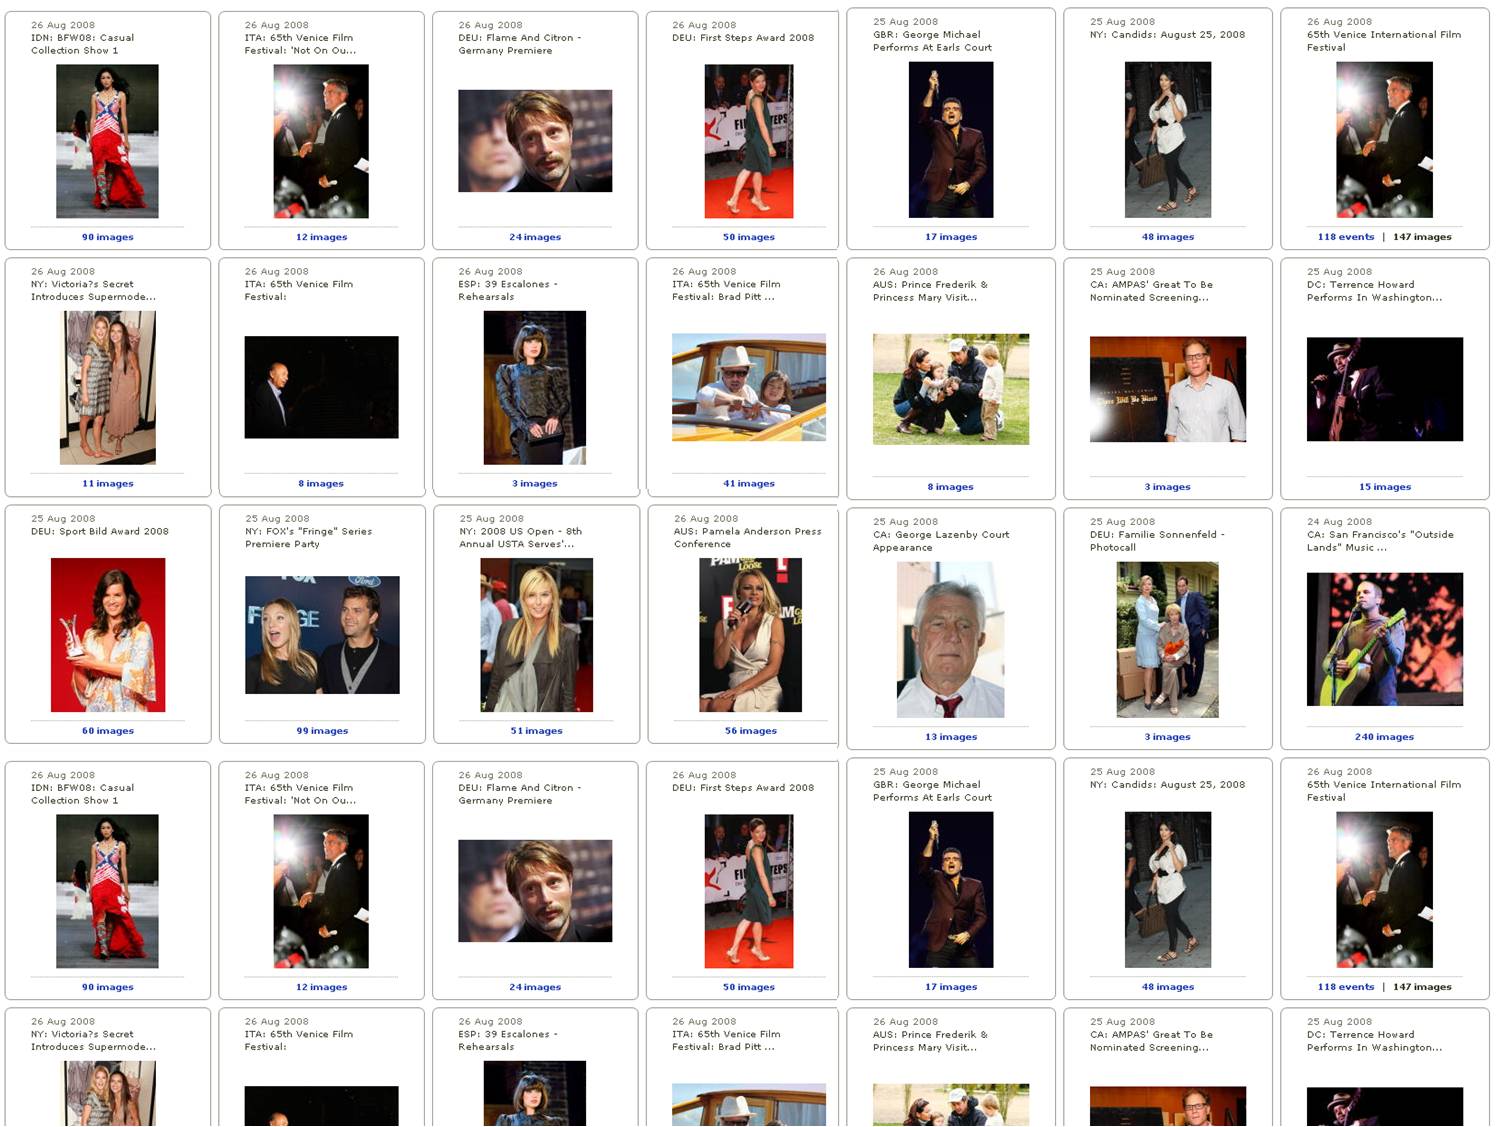
In the summer of 2008, Sarah Williams and the Spatial Information Design Lab set out to analyze the unique spatial and social dynamics created by the arts and entertainment industries in New York City and Los Angeles. Working with Elizabeth Currid from the University of Southern California, the lab used a database of arts and entertainment event photography by Getty Images as a proxy for social interaction in geographical space. Because photographs taken by Getty are tagged with location information, they are transformed into data with an unexpectedly powerful spatial component.
The results of the research showed that both Los Angeles and New York have unique “event geographies”, or locations of interest to Getty photographers that reappear at a statistically higher rate than the rest of the city. While each arts industry showed some tendencies toward specific locations, the events of all the industries are largely held in very similar locations, suggesting that event sites appear to be closely linked to iconic symbols in both cities.
Exhibition

This work illustrates how records in Getty Images database can be used to under- stand the spatial clustering patterns of the social milieu and more broadly the patterns of media representation of cultural industries. The work also shows how static quantitative data can be transformed to explain complex social/spatial patterns.
By geo-referencing, coding, and performing statistical analysis on 6,000 events and 300,000 photographs taken by Getty Images in New York and Los Angeles, the research team has shown that cultural industry events tend to cluster spatially. While the data might illustrate what we already know—that city’s have “hot spots” — investi- gating them in this way allowed for a clearer understanding of why clustering occurs in certain localities.
Analysis of the data showed that those actors not conventionally involved in city development (paparazzi, marketers, media) have unintentionally played a significant role in city development and how we as- sociate places with industries, events, and products. The findings also help to explain how the geographical form of industrial social clustering might work beyond cultural industries. The use of Getty data provides a new spatial dimension by which we can un- derstand cultural industries and their urban geographical patterns.
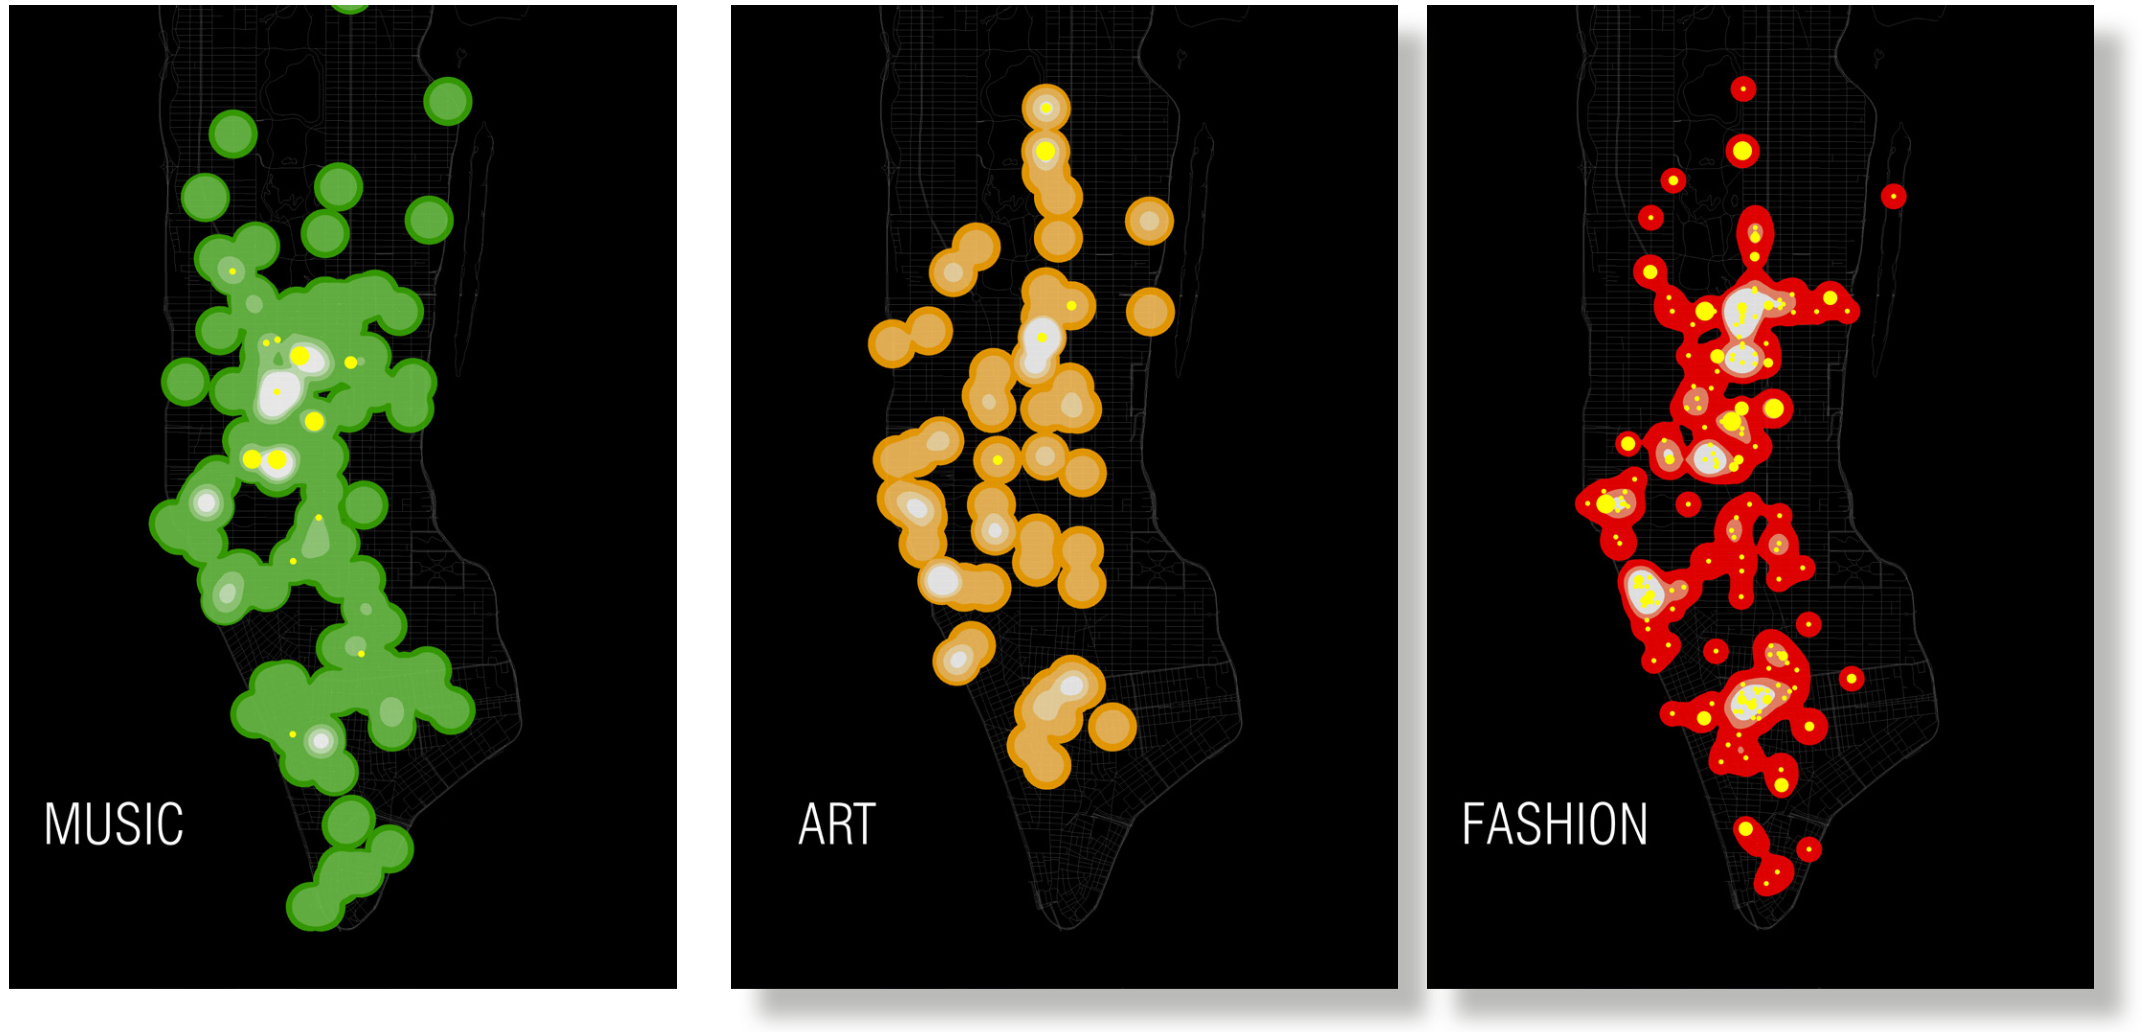
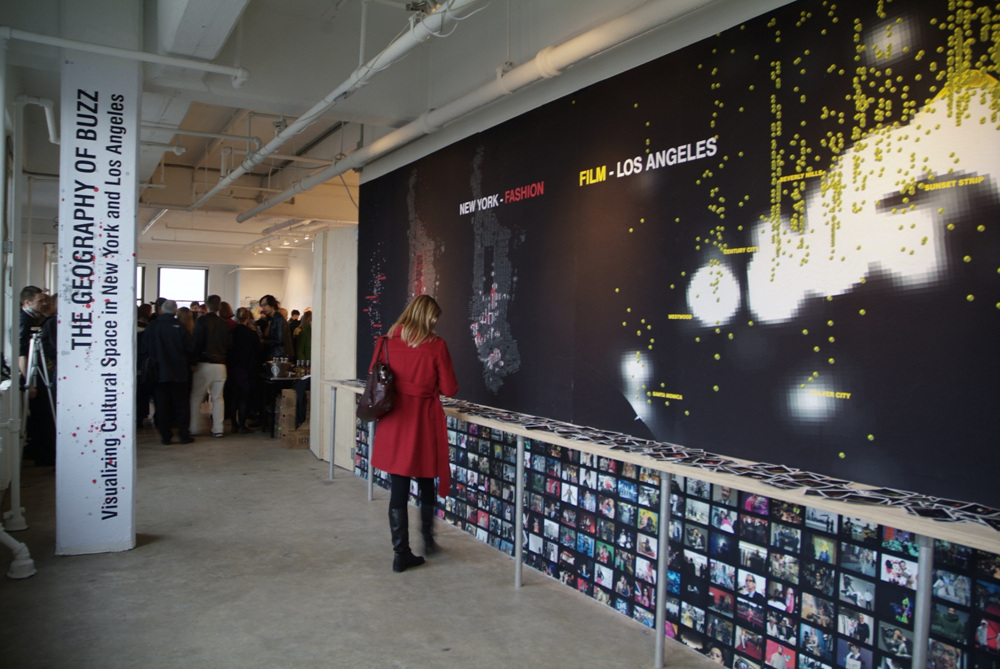
The exhibit highlights the research findings in both New York and Los Angeles. In each city the spatial clustering pattern of art, fashion, music, theater, film, and television events were analyzed. The research found that both city’s have “event enclaves” or locations in the city where events happen more often. These event enclaves are presented here as density maps with an overlay that shows the location of the event. The diameter of the overlay points correspond with the number of images taken at an event. The maps illustrate the clustering tendencies of each arts and culture sub-group overall, at the same time they highlight the event locations that are shared by multiple groups.

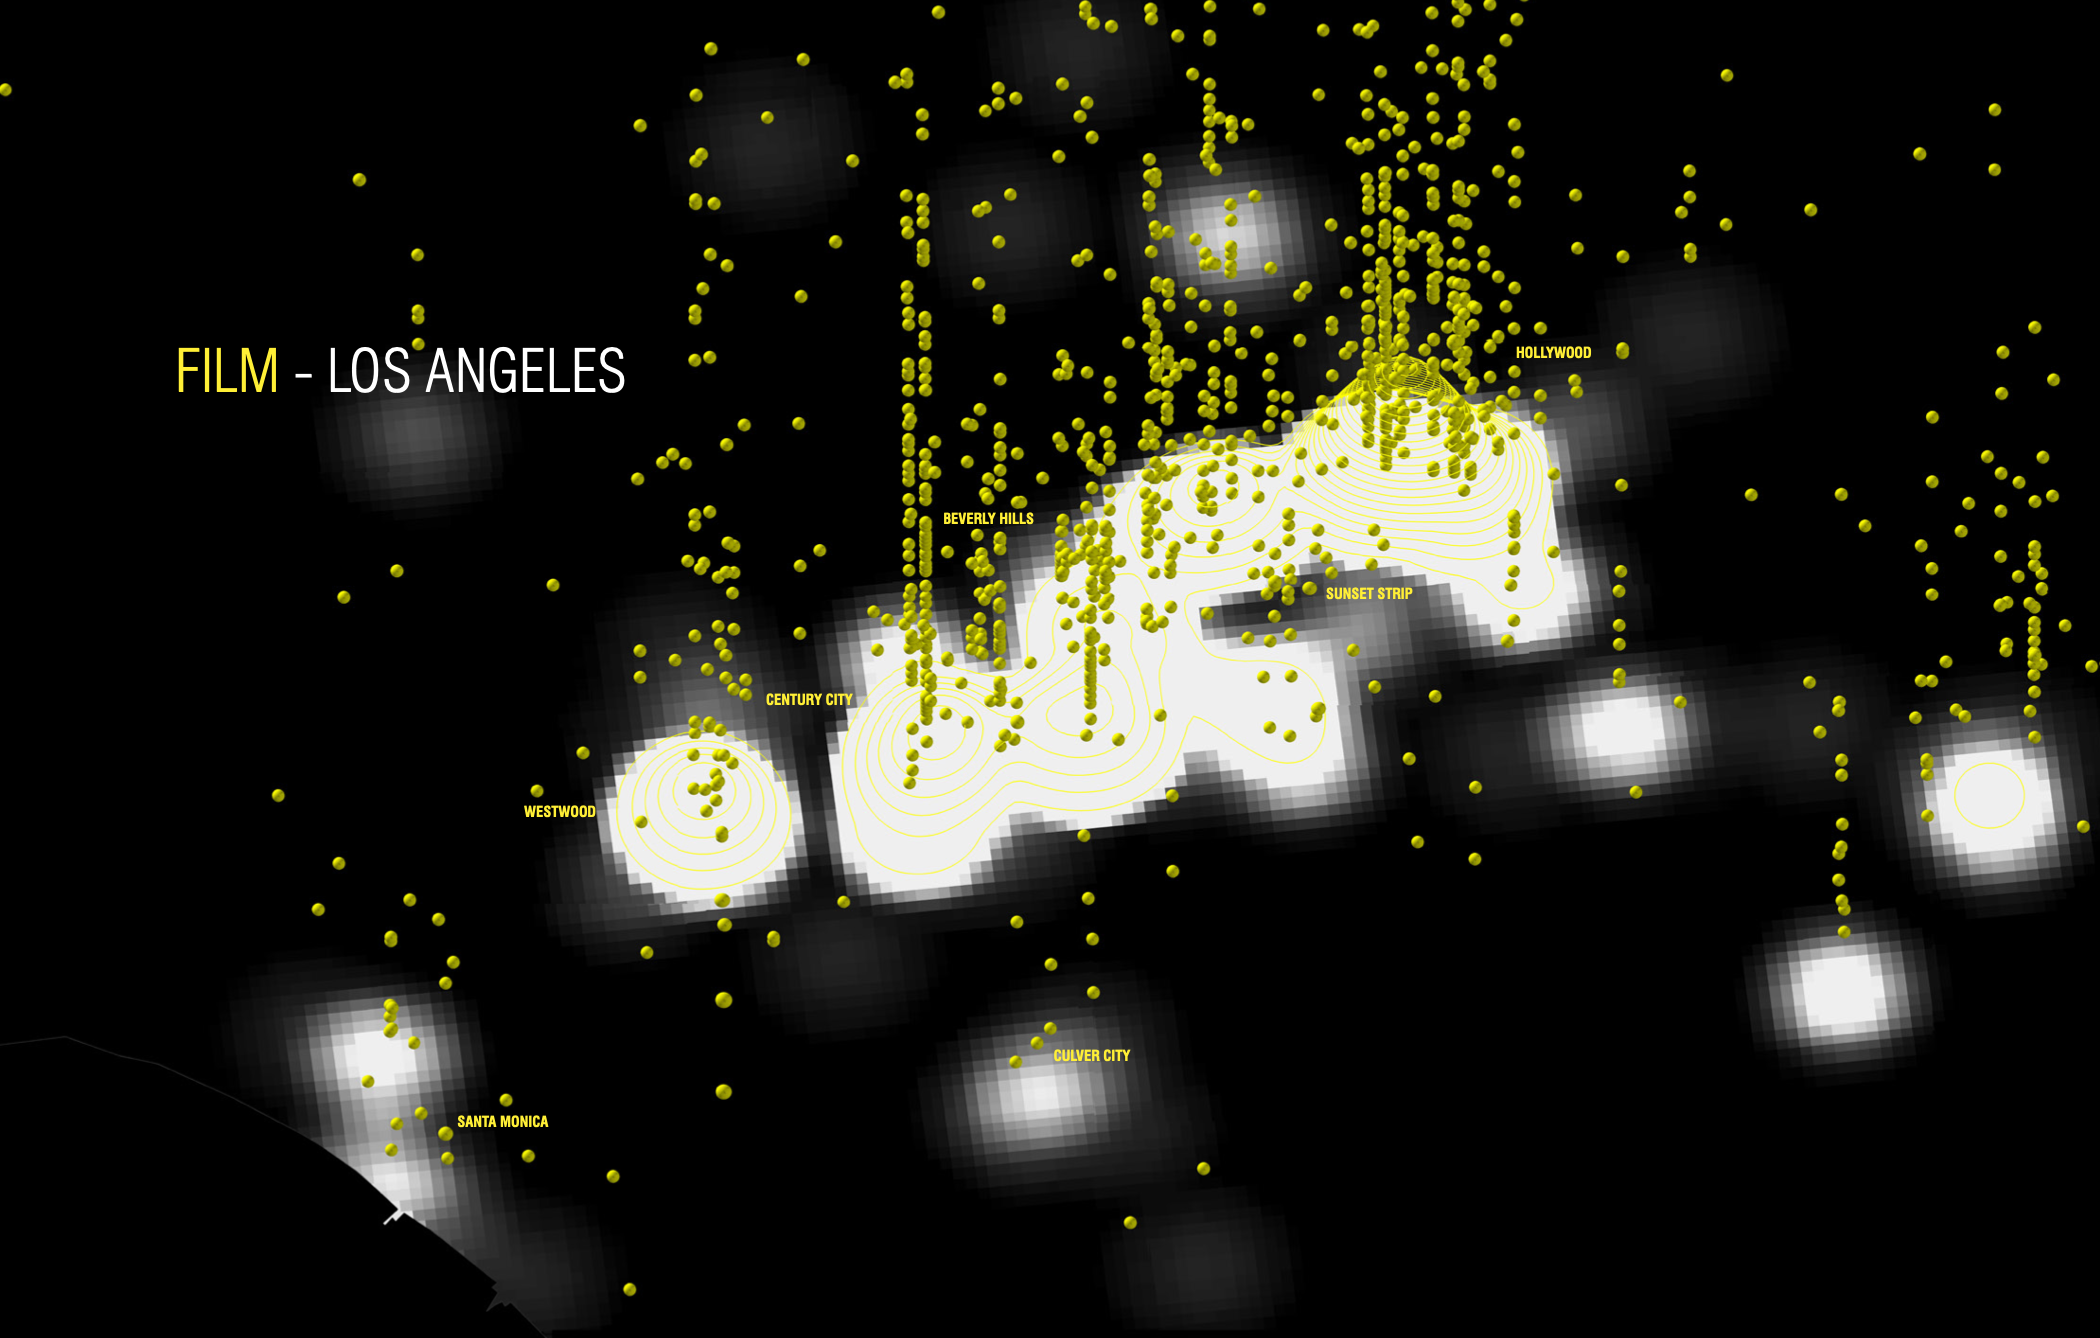
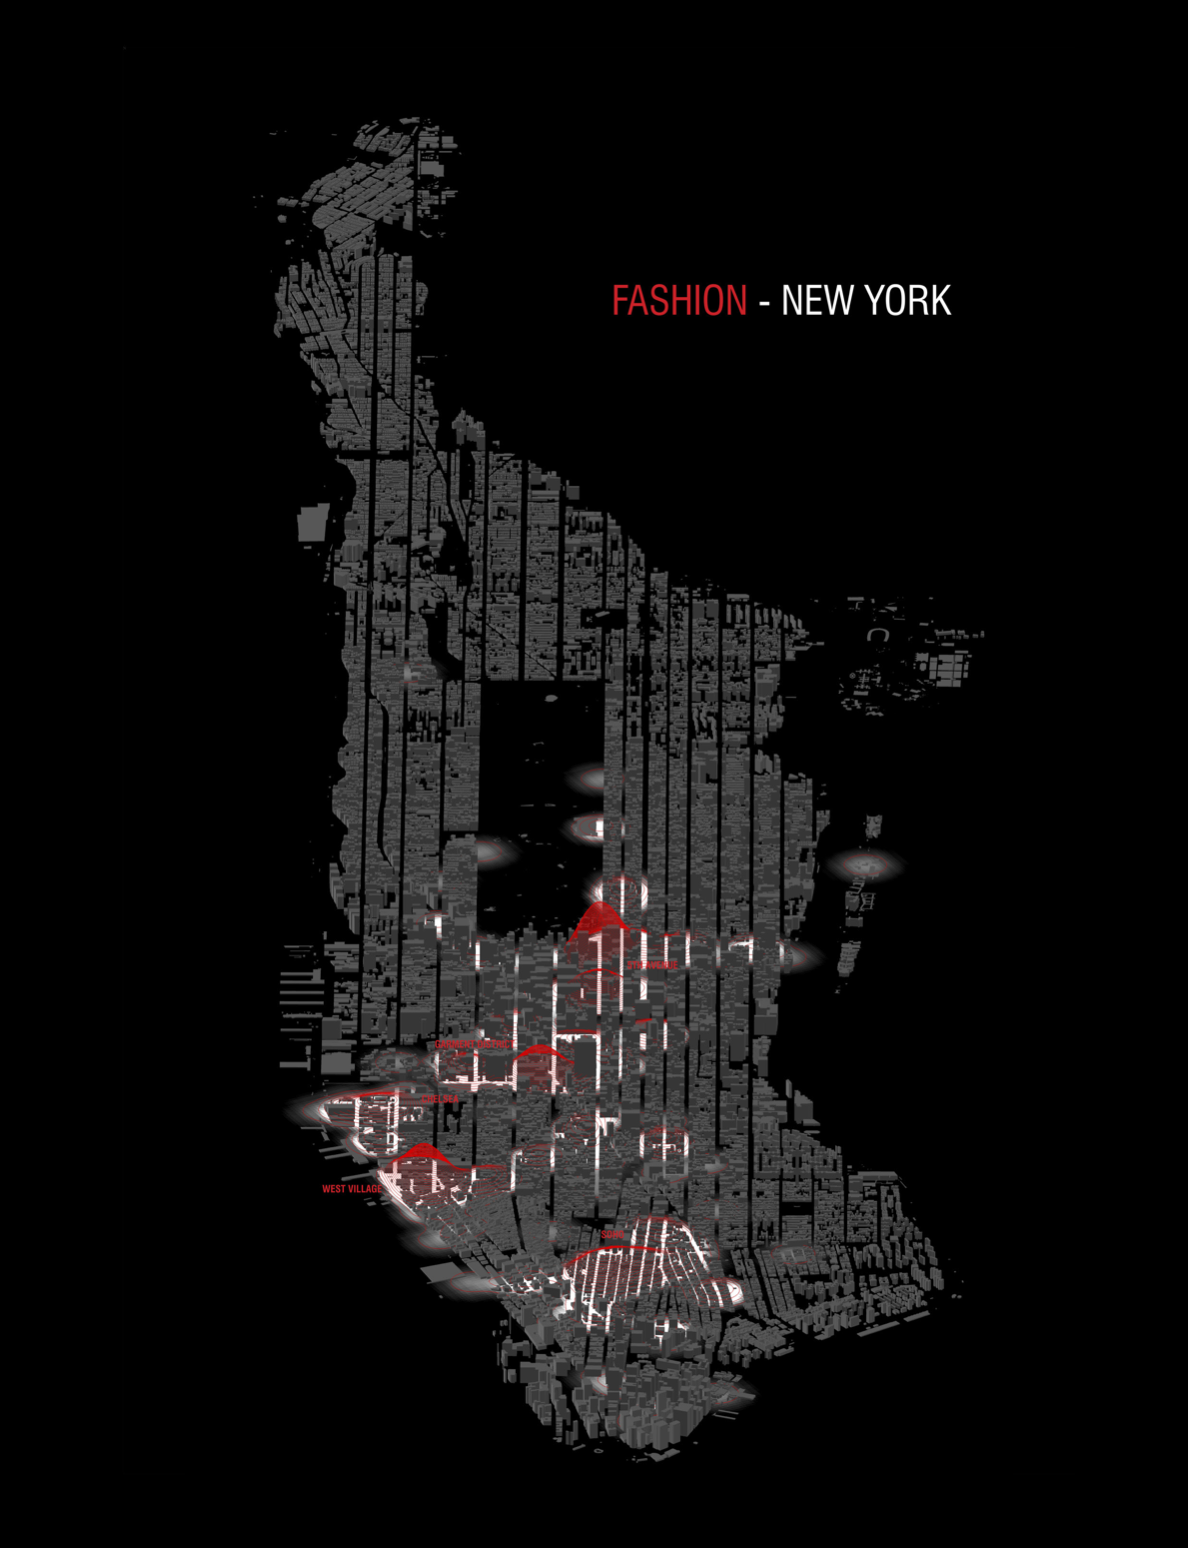
The artwork also highlights a dominant cultural industry in each city as topographic “event-scapes.” In New York the map illustrates the concept of fashion enclaves by using contours lines which measure the density of events. The image reveals a fashion event geography as varied as the industry itself, from the boutiques of Soho to the industrial storefronts of the Garment District to the corporate flash of 5th Avenue.
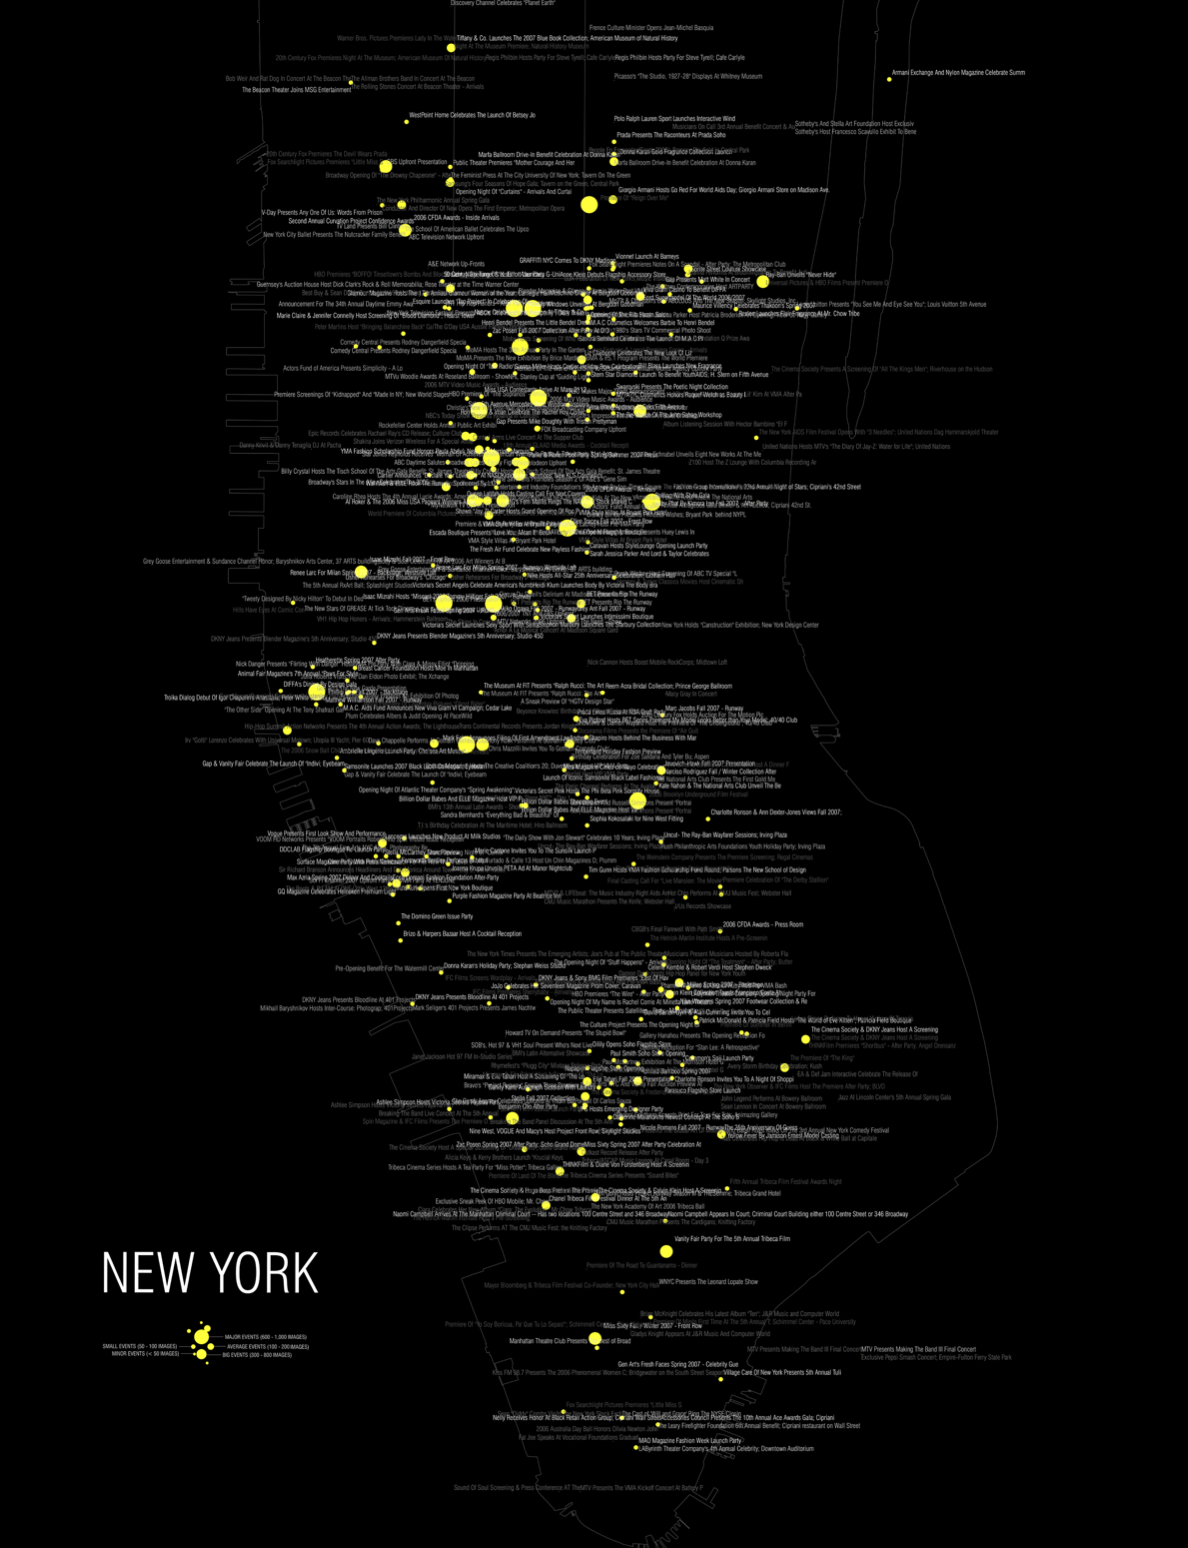
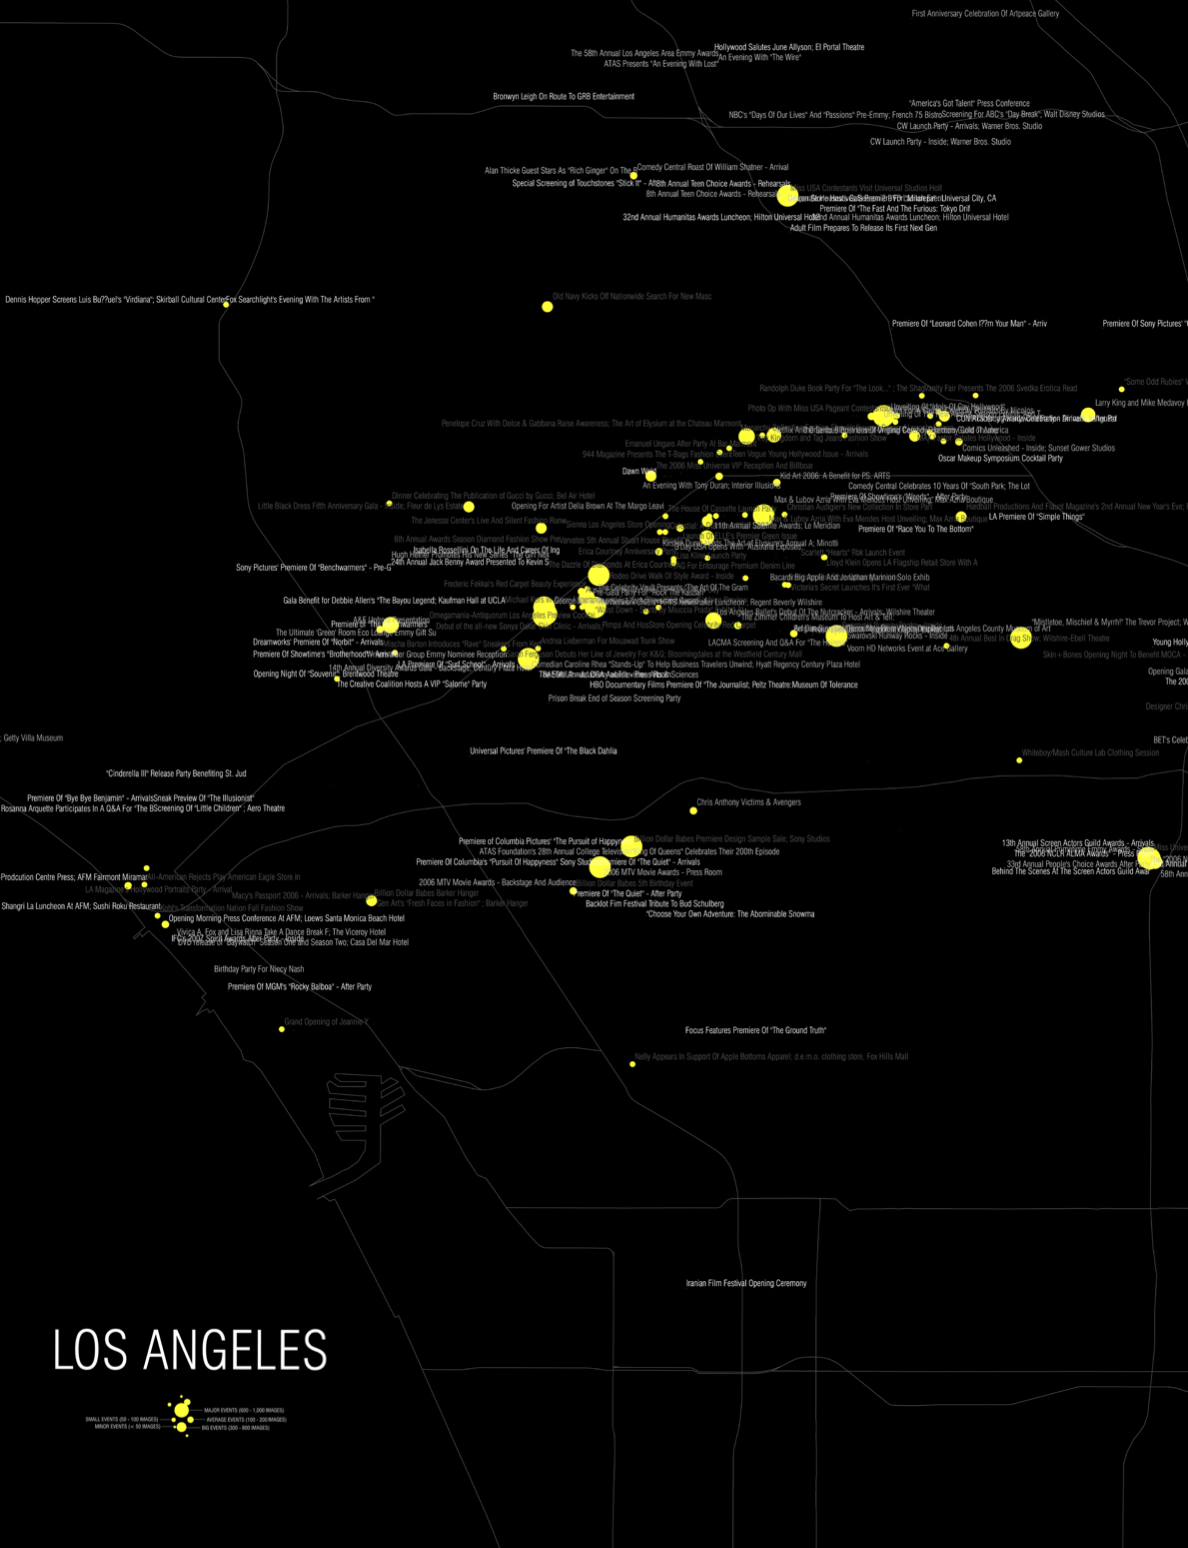
Two large constellation maps or show the location of events as well along with event descriptions. The grouping of the descriptions on the map highlights the clustering of events in certain locations. The maps help to decode the Getty database as one can see the type of events that happen at certain localities. The maps themselves give a sense of motion to the events as they appear to be floating.

 The Geography of Buzz exhibition at STUDIO- X Gallery in New York City was featured on the front page of the New York
Times, April 7, 2019.
The Geography of Buzz exhibition at STUDIO- X Gallery in New York City was featured on the front page of the New York
Times, April 7, 2019.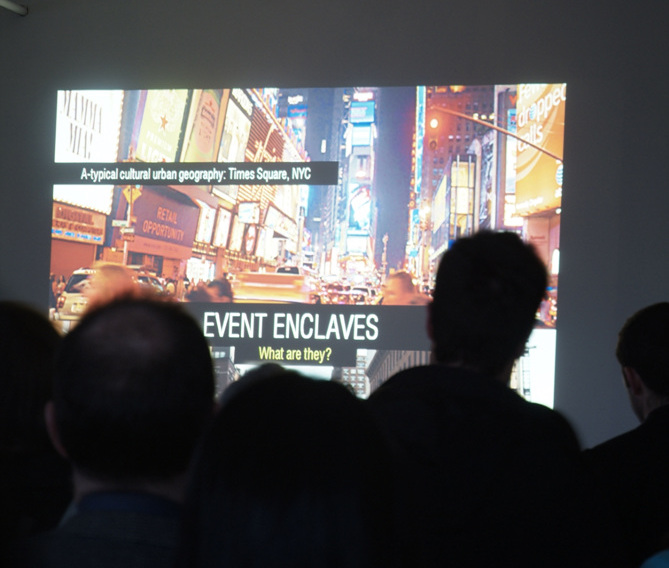
Publications
Currid, Elizabeth and Sarah Williams. “The Geography of Buzz: Art, Culture and the Social Milleu in Los Angeles and New York,” Journal of Economic Geography, (2009): 1-29.
McCorquodale, Duncan, Editor. Mapping New York, Black Dog Publishers, London, UK, 2009.
Exhibition
The Geography of Buzz. Permanent Installation, School of Policy Planning and Development, University of Southern California, Los Angeles, CA, 2009.
The Geography of Buzz, STUDIO- X Gallery, Columbia University , Graduate School of Architecture Planning and Preservation, Columbia University, New York, NY, 2009.
Press
“Experimental Geography Meets Art.” Christian Sci- ence Monitor, 2009.
“The Geography of Buzz.” Smart City Radio, 2009.
“Mapping the Geography
of Cultural Buzz in LA and NY.” Information Aesthetics, 2009.
“The Geography of Buzz.” Australian Broadcasting Corporation, 2009.
“The Geography of Buzz.” BBC World News Tonight, 2009.
“The Geography of Buzz.” Time, 2009.
“Mapping the Cultural Buzz: How Cool Is That.” New York Times, 2009.
“New York and the Vanguard of Digital Design.” New York Times, 2008