Industry In Motion
2010
︎︎︎ Project Website
Project Lead
Sarah Williams
Elizabeth Currid-Halkett
Project Manager
Georgia Bullen
Research Assistants
Fatima Abdul-Nabi
Adare Blumenfeld
Judy Chang
Jen Godzeno
Caitlin Hackett
Alex McQuilkin
Fred Sham
Carlos Echavarría
Nathan Tinclair
Support from
The Rockefeller Foundation
︎︎︎ Project Website
Project Lead
Sarah Williams
Elizabeth Currid-Halkett
Project Manager
Georgia Bullen
Research Assistants
Fatima Abdul-Nabi
Adare Blumenfeld
Judy Chang
Jen Godzeno
Caitlin Hackett
Alex McQuilkin
Fred Sham
Carlos Echavarría
Nathan Tinclair
Support from
The Rockefeller Foundation
Overview
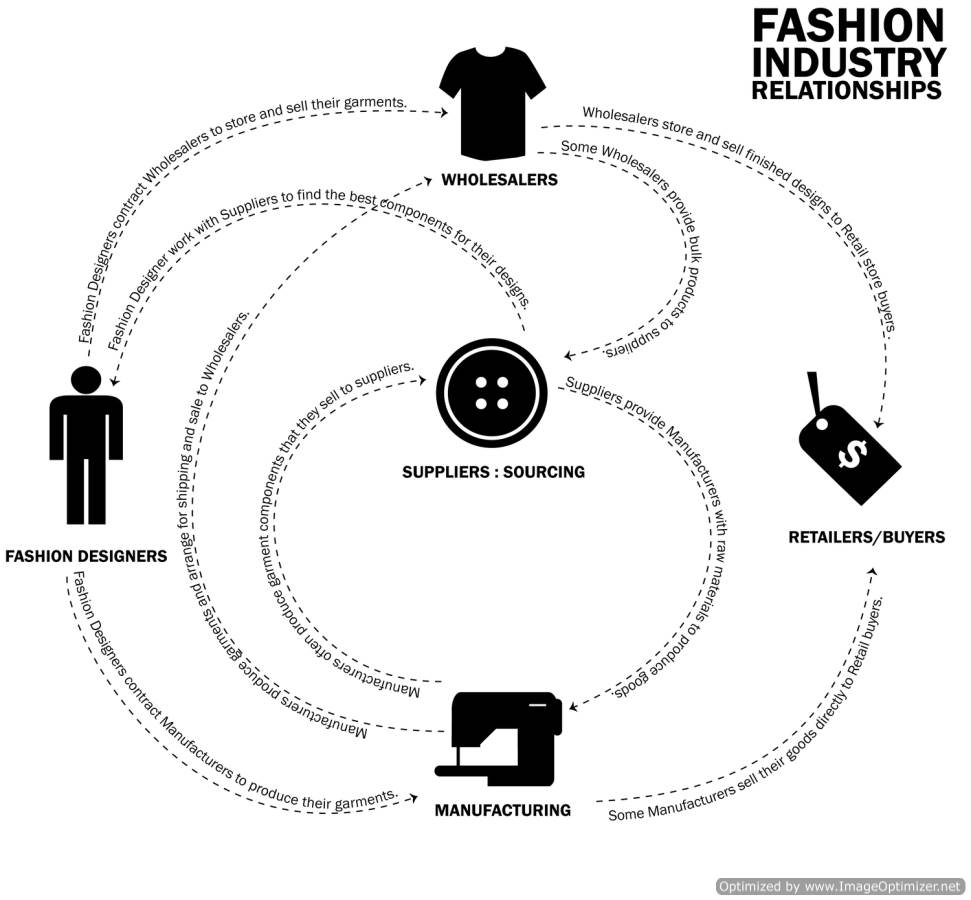
New York City’s Garment District is located in between some of the highest valued real estate in New York City. So it is not surprising that in 2010, New York officials, spurred by landlords and surrounding development pressures, removed protective zoning which allowed for decreased rents. Fashion designers argued that removing the zoning protections would cause economic losses to the industry.
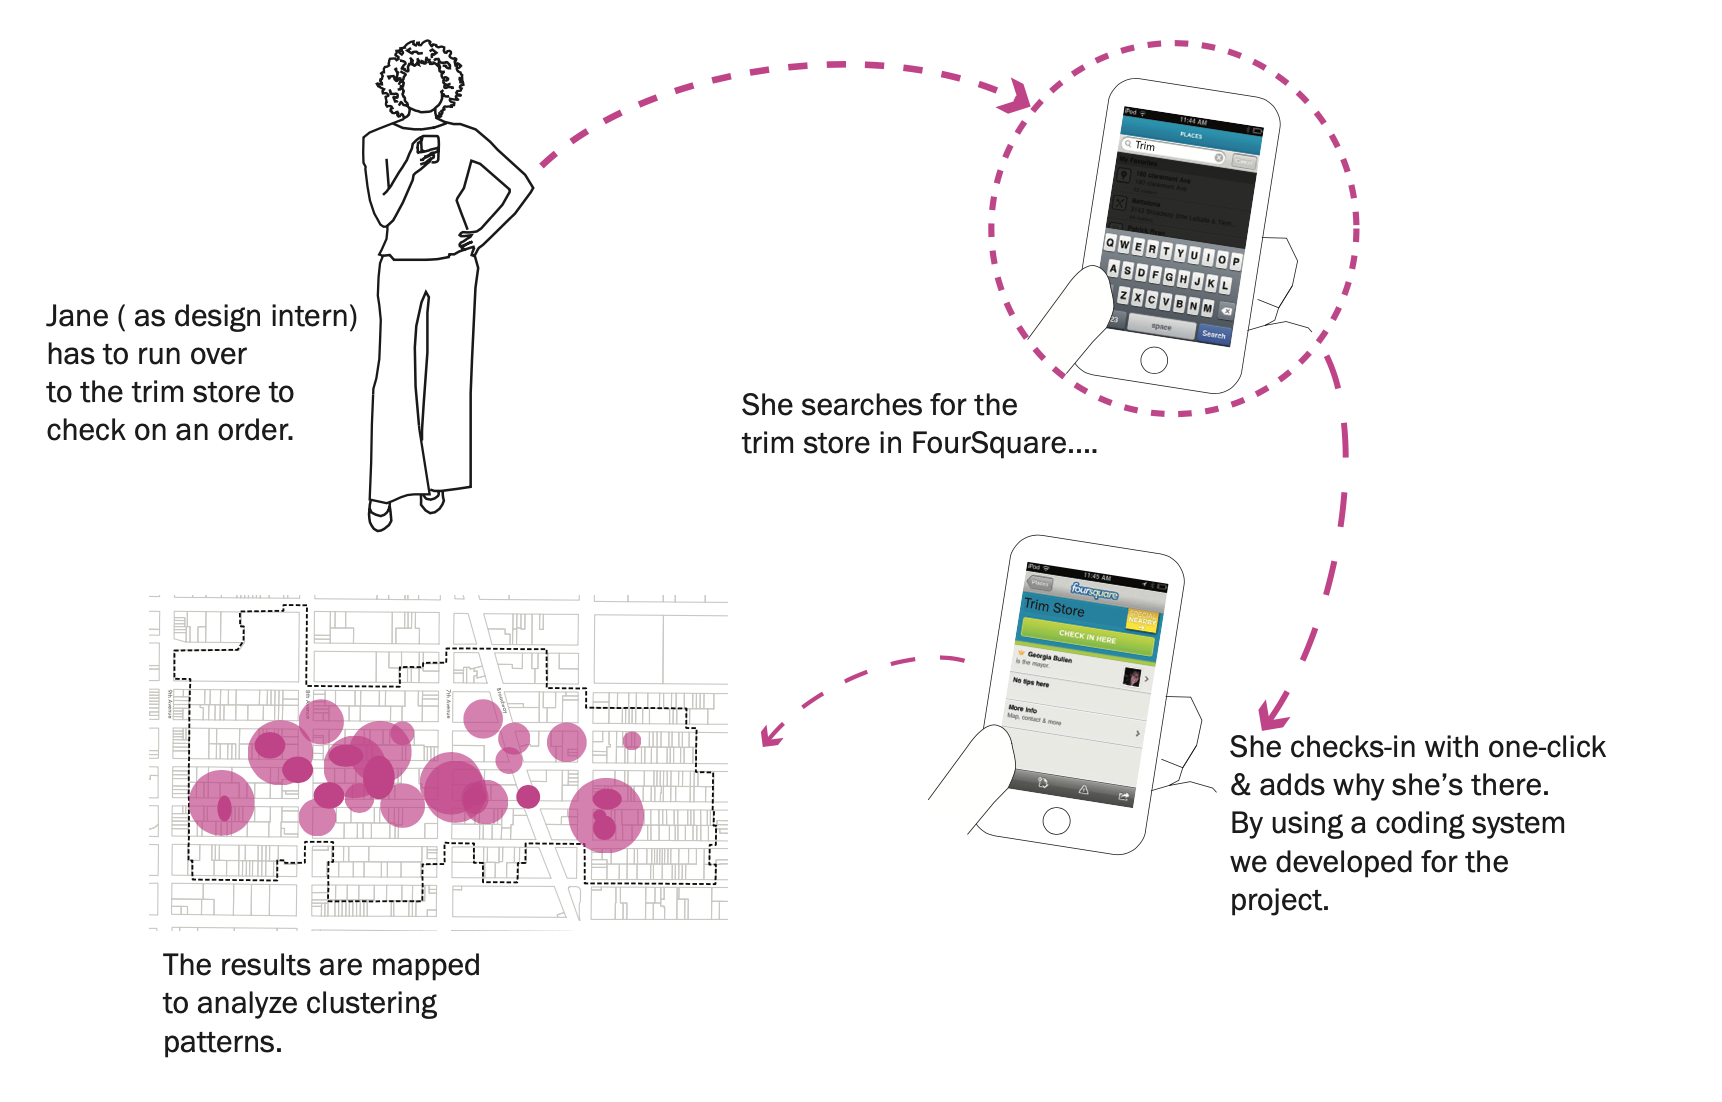
In this project Williams and Currid- Halkett set out to understand how the agglomeration economy worked in real time by tracking 100 apparel industry workers for a two-week period using their cell phones and a Foursquare Social media app.
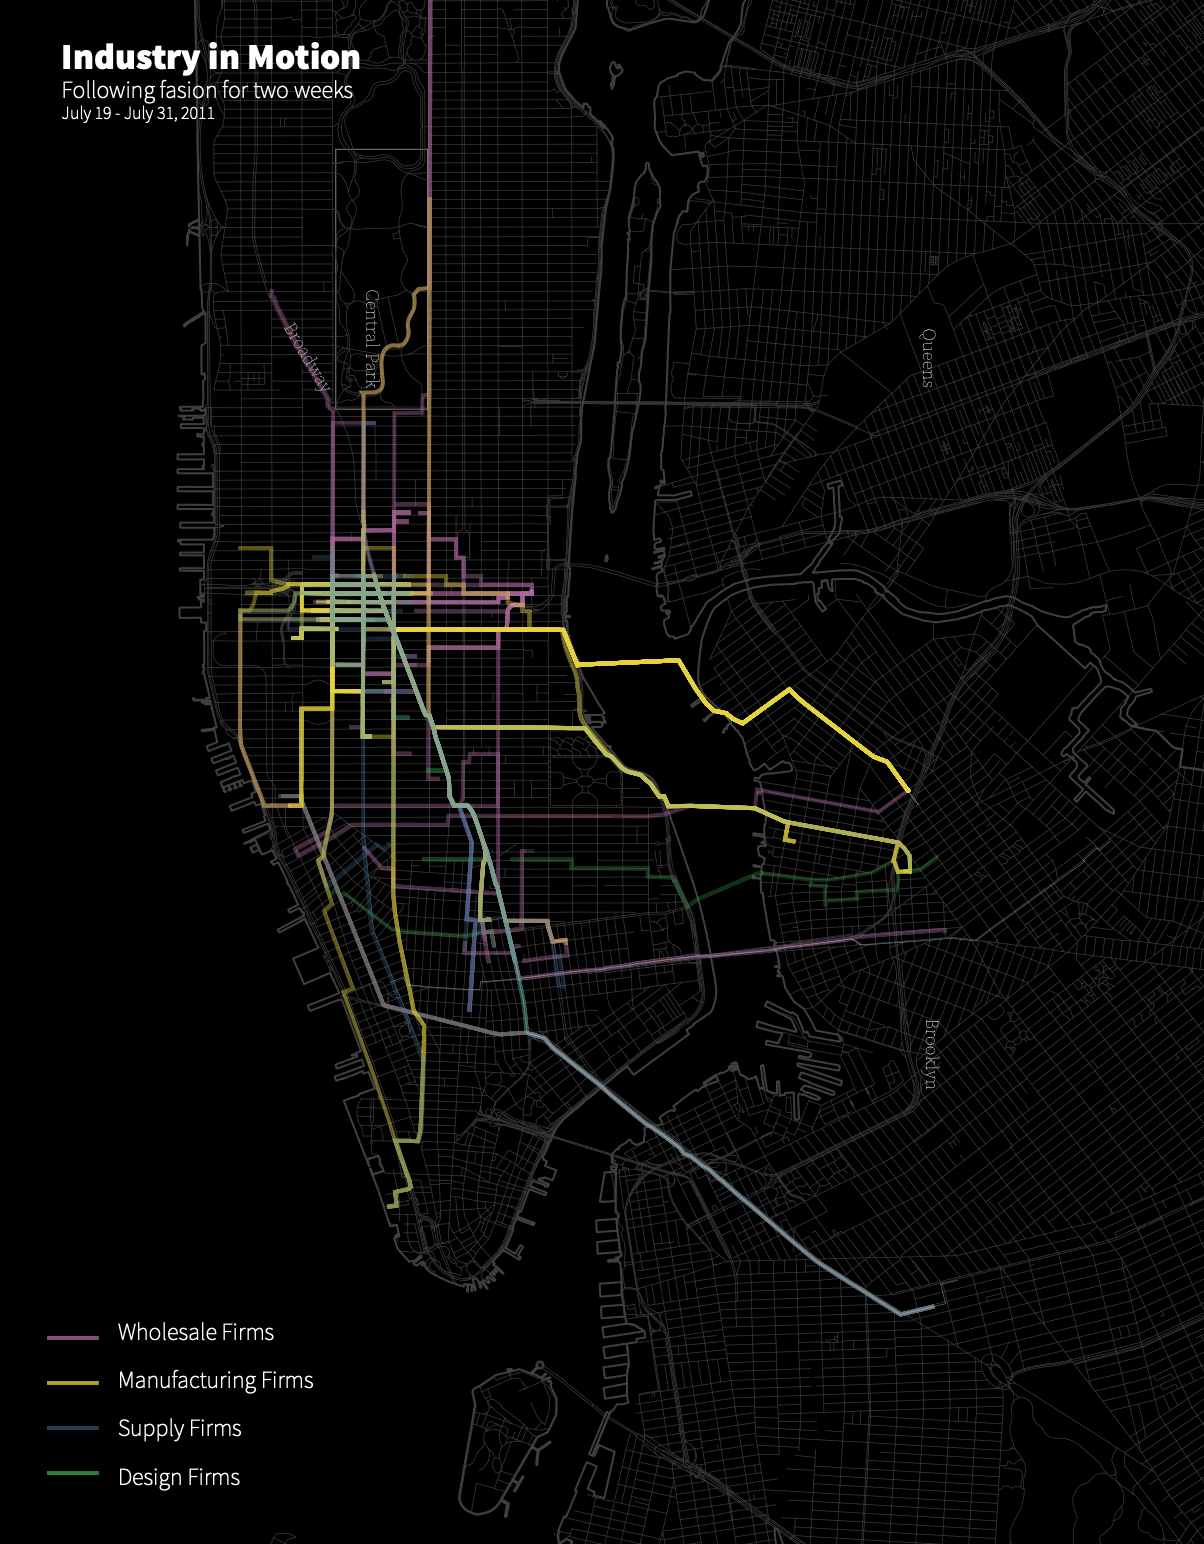
Analysis of the data shows that parts of the Garment District remained very active and that many of the large and mid-level design firms, those seen on runways during fashion week, depend on these businesses. The majority of businesses visited during the study fell along the 8th Avenue corridor, which was in sharp contrast to traditional data sets that showed a density closer to Broadway. The results helped create more nuanced zoning for the district, focusing on the 8th Avenue corridor.
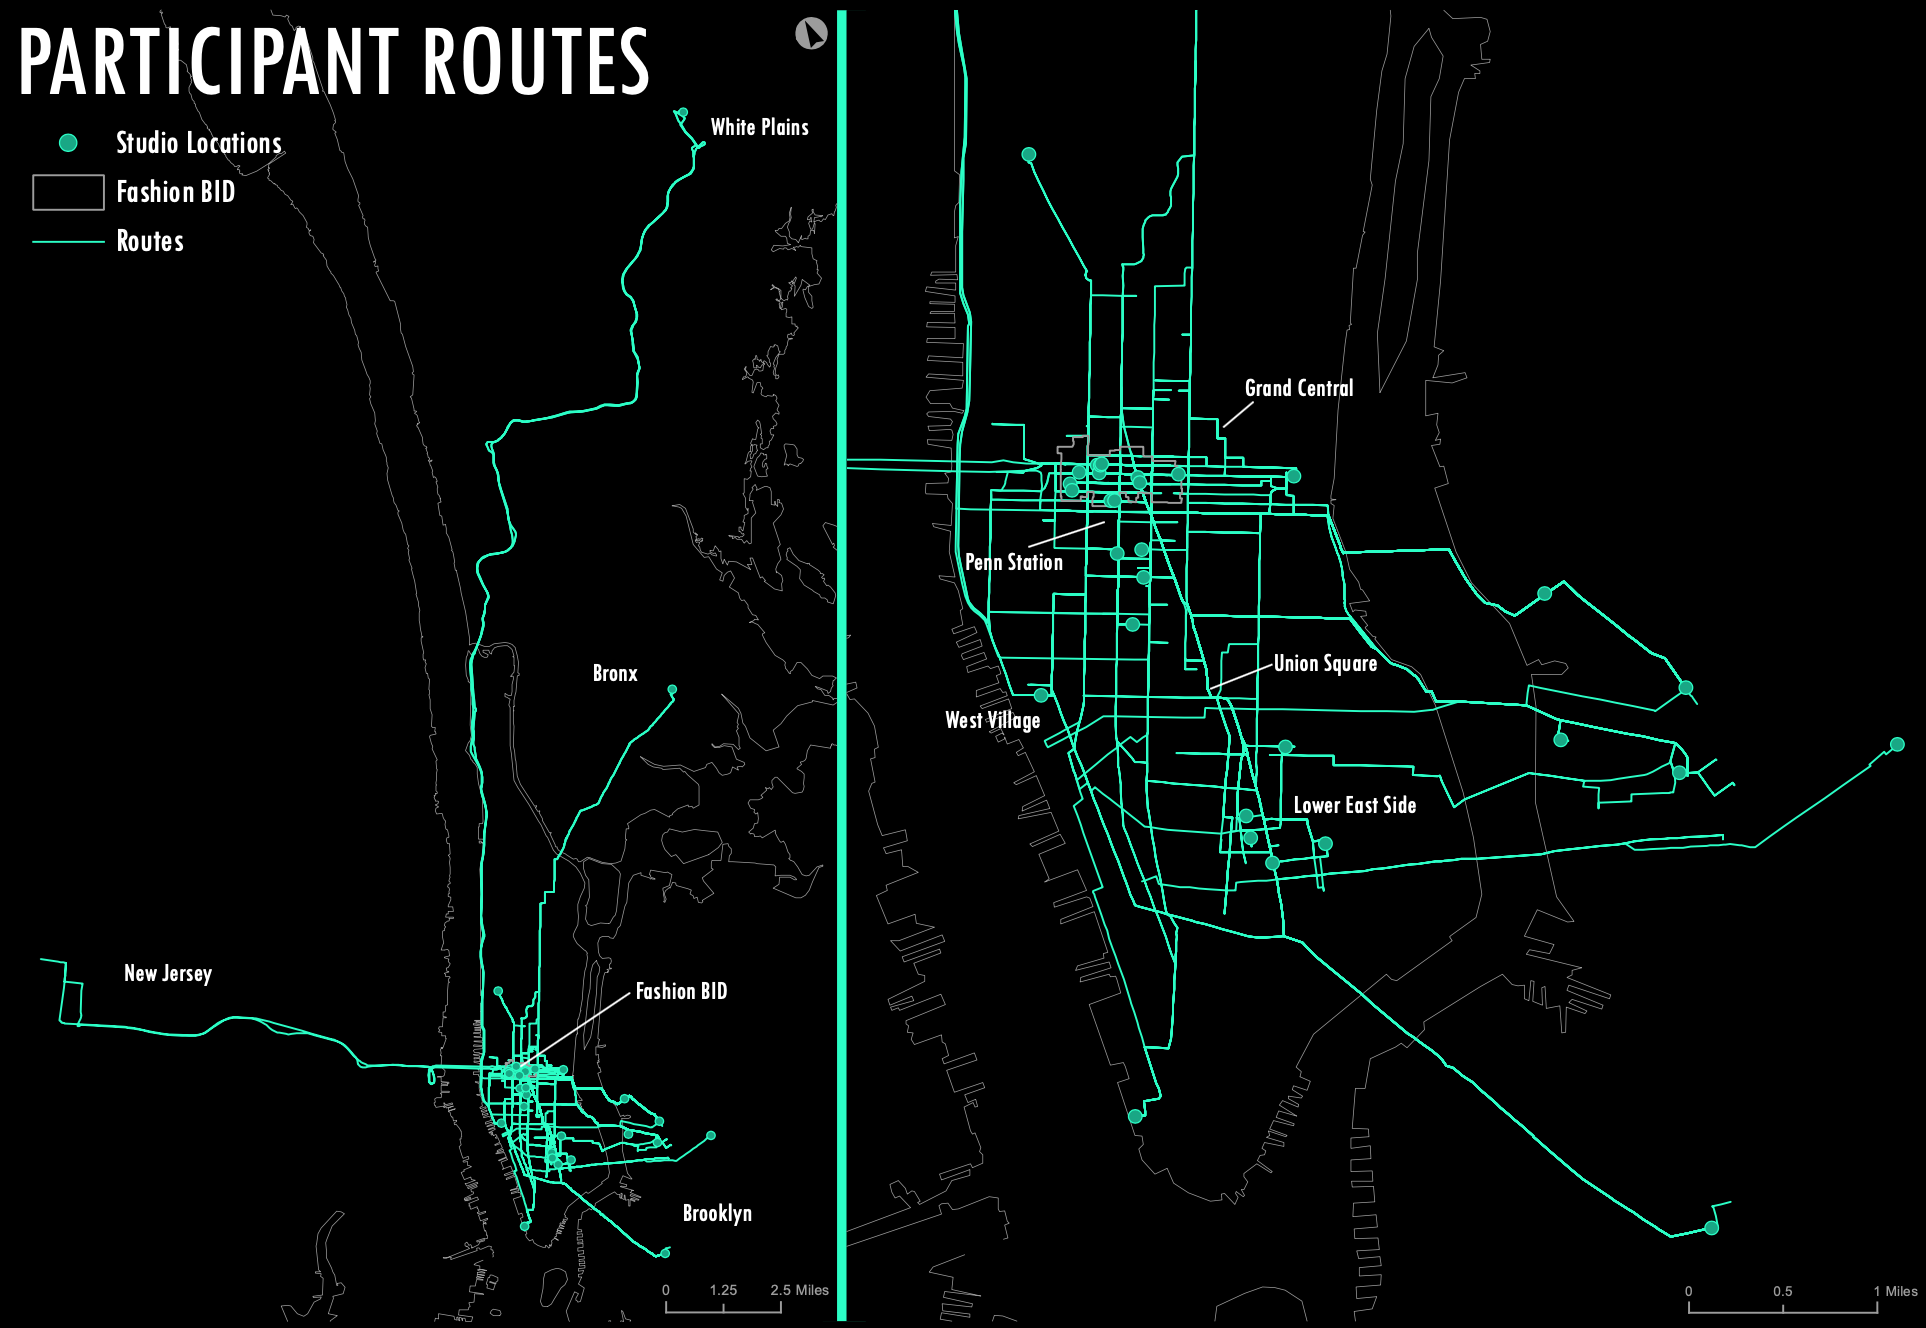
Tracking Designers
One hundred fashion designers installed foursquare on their phone. Using a log-in the research team assigned, they used the tool to check-in to every business location they went the visited over a two week period. The individual log-in allowed the team to see what study participants were doing in real time and remind them to check in if they had not over a long period.
Fashion designers who had their studio’s inside the garment district tended to make more trips per day with more trips with only one, two, three stops per trip, while fashion designers outside the garment district often had more stops per trips. The garment district was efficient to outside designers who would travel to the neighborhood and then perform several stops once there.
Findings
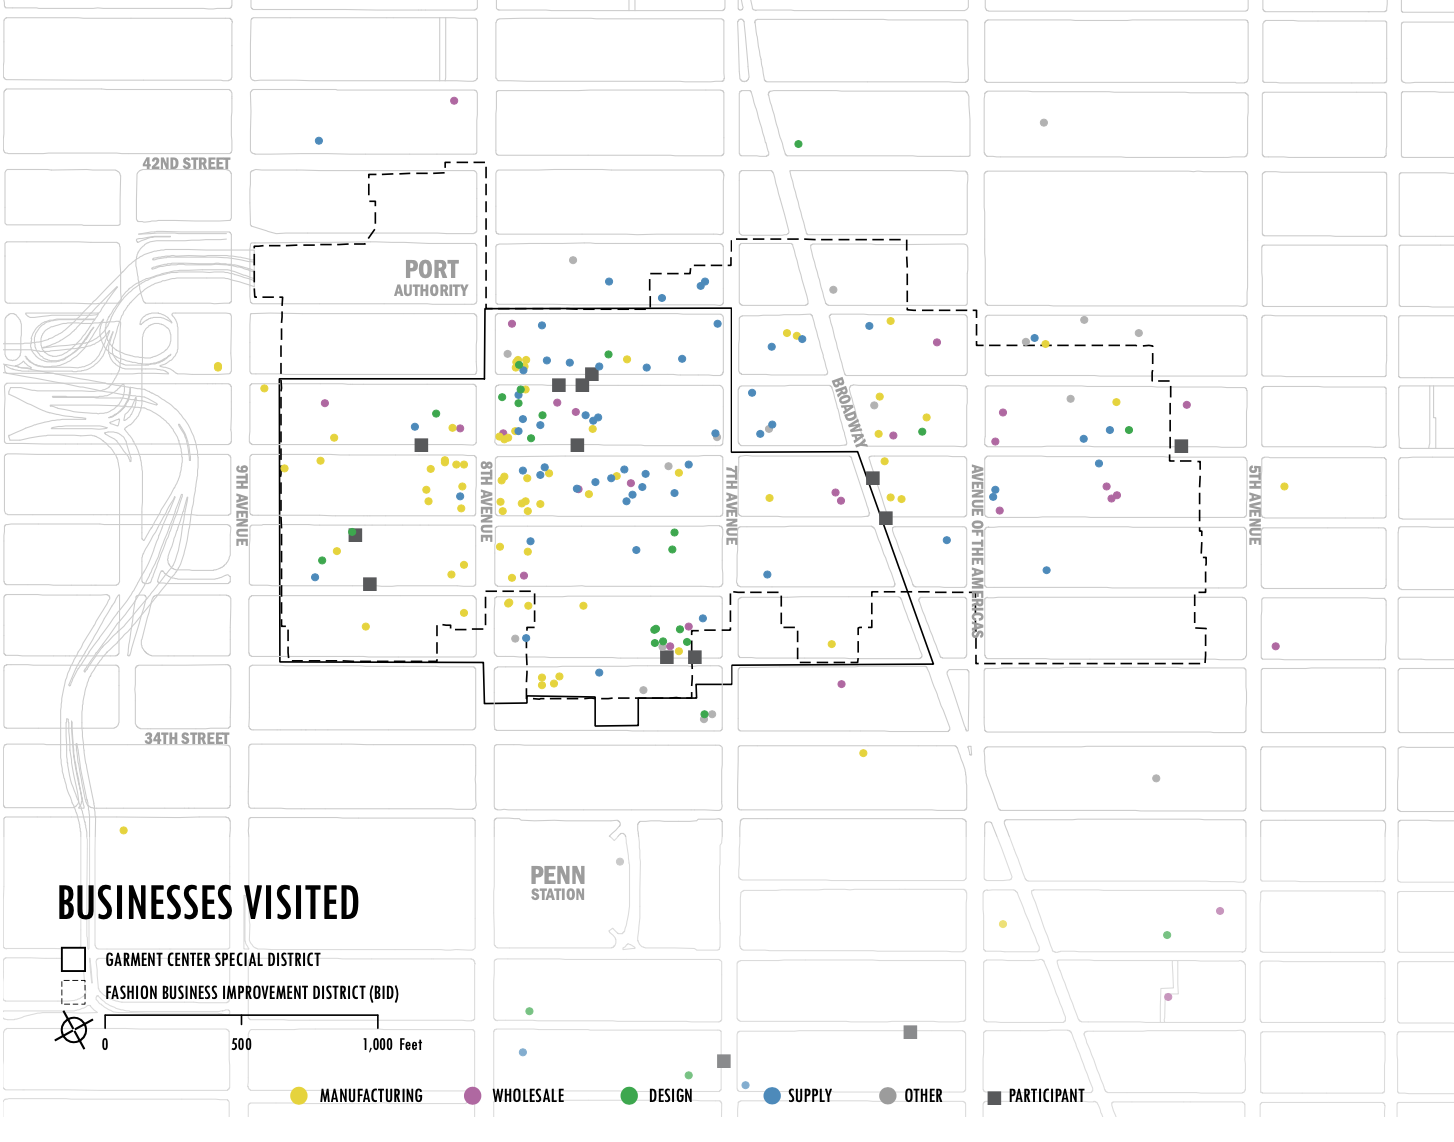
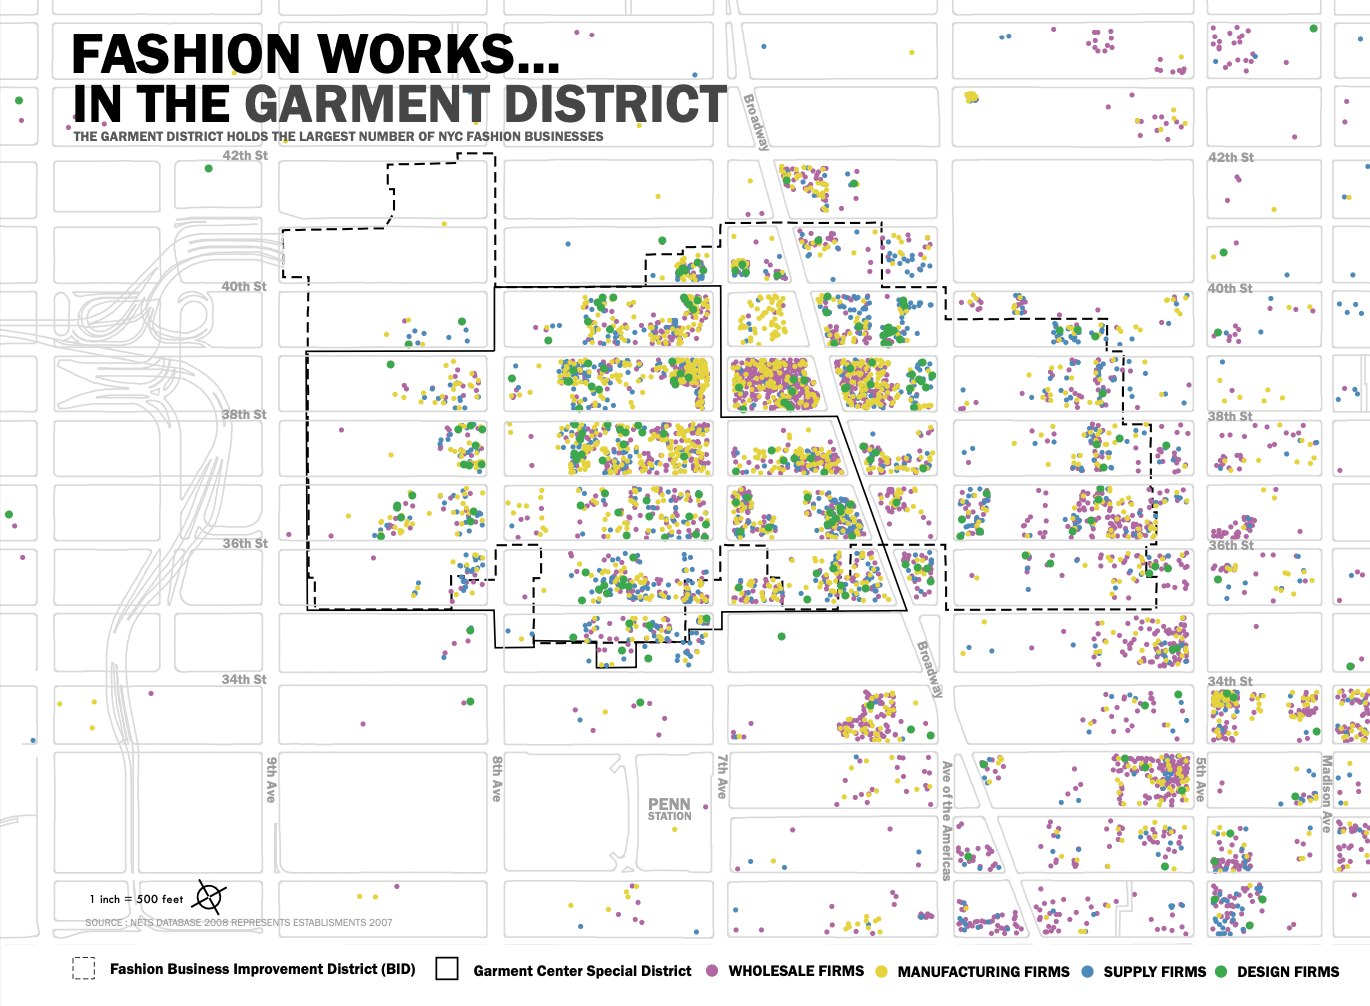
The study found that the majority of designers used manufacturer around 8th avenue during the study period (top). It was previously thought that more manufacturers were closer to Broadway because data captured from the economic census showed more businesses in this area (bottom). When the research team took a closer look into this discrepancy, it was found that while the companies near Broadway were technically manufacturers, but other types including model builders and architecture fabricators.
Publication
Williams, Sarah, and Elizabeth Currid-Halkett. “Industry in Motion: Using Smart Phones to Explore the Spatial Network of the Garment Industry in New York City.” PloS one 9, no. 2 (2014): e86165.
Currid-Halkett, Elizabeth, and Sarah Williams. “Every Step You Take: Using Cell Phones and Social Media to Track the Economic and Social Behavior of Workers in an Industrial Cluster.” Journal of Planning Education and Research (Revise and Resubmit, October 2018).
Press
“NYC Garment District Designers: Always in Vogue.” USC News, Merrill Balassone, 2014.
“Check In Fashion Uses FourSquare to Map the Garment District.” NBC Thread Blog, 2011.
“Mayor of the Garment District: Using FourSquare to Track Designers.” The Midtown Gazette, 2010.