Connecting The Unconnected
2017-2018
Project Lead
Sarah Williams
Researchers
Kadeem Kahn
Mario Giampieri
Facebook Researcher Martijn de Jongh
Support from
Facebook
Project Lead
Sarah Williams
Researchers
Kadeem Kahn
Mario Giampieri
Facebook Researcher Martijn de Jongh
Support from
Overview
Robust information is essential when making decisions about city services, yet in many rapidly developing cities, the necessary information is scarce and when available, the quality and scale of the information makes it inadequate for decision- making. At the same time, companies such as Facebook can produce an aggregated and de-identified view of the world which can generate helpful insights for urban policy - including the development of telecommunication infrastructure.
This research tests whether de-identified information could be used in a computational model to analyze the spatial distribution of internet connectivity in Nairobi, Kenya and Kampala, Uganda. The Cities Connectivity Index (CCI), developed through this work is a scalable model, built in collaboration with Facebook, that combines information on the level of internet activity, connection quality, and network coverage to provide a score for internet connectivity. The CCI scores are then combined with local information in Nairobi that are representative of demand such as transport, employment status, and population density to illustrate the potential to
use the CCI to identify demand for improvements to internet infrastructure, illustrating how this information could be used for infrastructure planning. The results were verified through site visits in Nairobi where a survey was administered. The results showed those areas with the highest need for internet improvement were consistently identified by the model, showing aggregated information about connectivity can be used to help develop a guide for the improvement of internet infrastructure in urban areas.
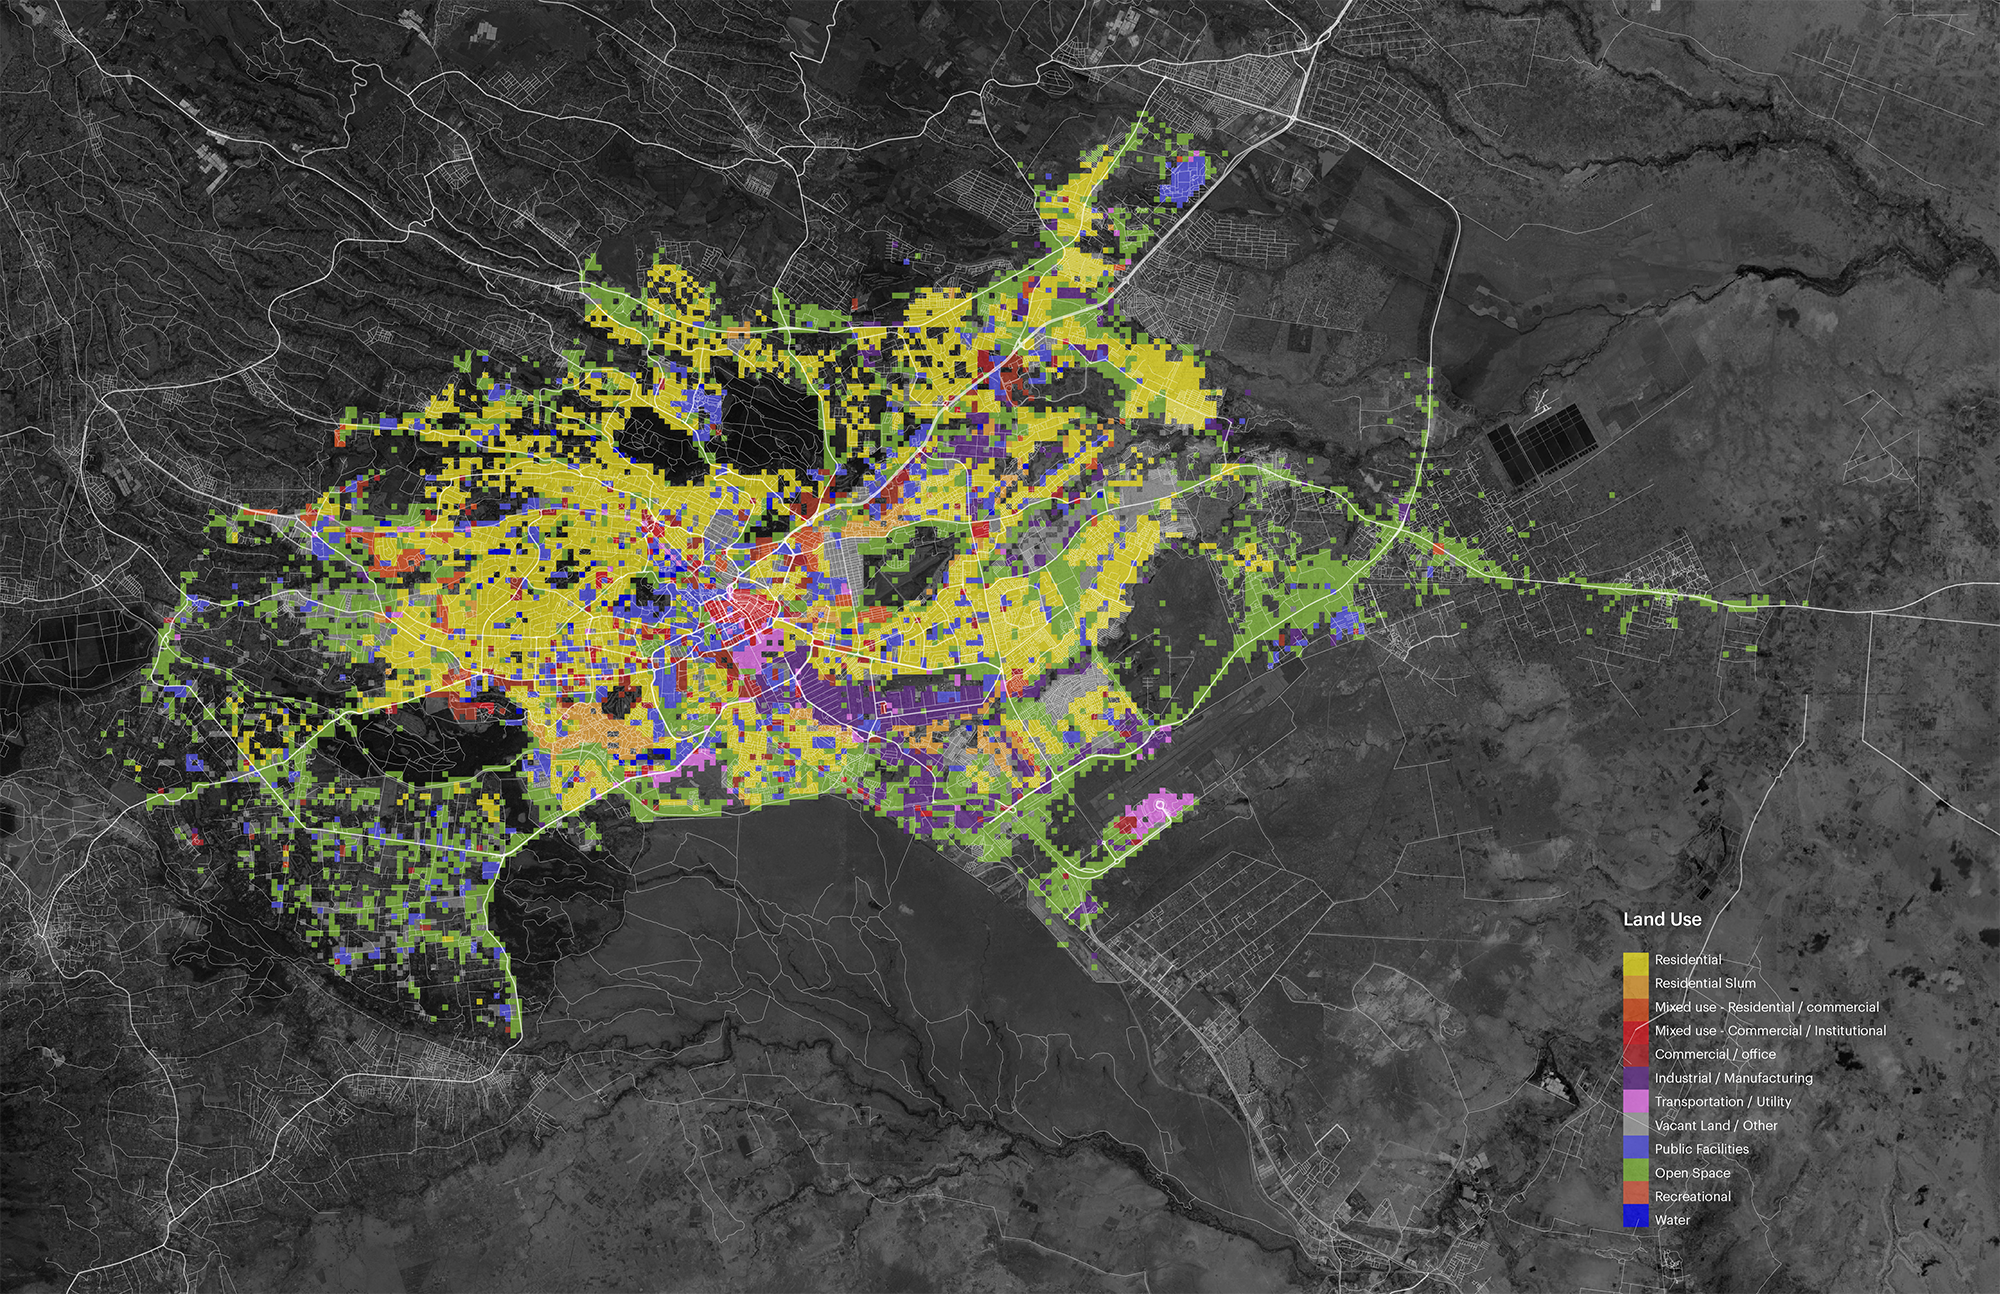
Land use data was created by scraping the Google places API and making the most dominant business type the land use for the areas. Land use was used to increase the demand for internet in areas with informal housing.
 This diagram shows how the team was able to determine land uses in the map above.