City Digits
2012-2016
︎︎︎ Project Website
Project Leads
Sarah Williams
Laurie Rubel
Valeria Mogivilevich
Christine Gaspar
Researcher Assistants
Pierre Beaudreau
Karuna Mehta
Phil Tinn
Jonah Rogoff
Erica Deahl
Alicia Rouault
Lee Dwyer
Collaborators
Brooklyn College
Center for Urban Pedagogy
Support from
The National Science Foundation
Overview
Data literacy - the ability to work with, analyze and make arguments with data - is essential for understanding and solving social and civic issues. City Digits develops and pilot tests innovative tools that help high school students learn mathematics for investigating their local environment. A collaborative project of MIT's Civic Data Design Lab, the Center for Urban Pedagogy (CUP), and CUNY's Brooklyn College, City Digits has developed two place-based curricular modules. Both incorporate geospatial technologies that enable students to explore their local urban landscape, collect field data, and organize and visualize patterns. Our first module, Local Lotto, introduced students to the statewide lottery system. Piloted in April 2013, students investigated the impact of the lotto in local neighborhoods while learning mathematical concepts such as data analysis and probability. The second module, Cash City, allowed students to explore the role and local impact of alternative financial institutions, such as pawnshops and check cashers. In addition to exploring ethical questions, students learned how to calculate interest. Cash City was piloted in Brooklyn’s Bushwick School for Social Justice in November 2014.
The work was supported by the National Science Foundation under Grant No. DRL-1222430. Any opinions, findings, and conclusions or recommendations expressed in this material are those of the author(s) and do not necessarily reflect the views of the National Science Foundation
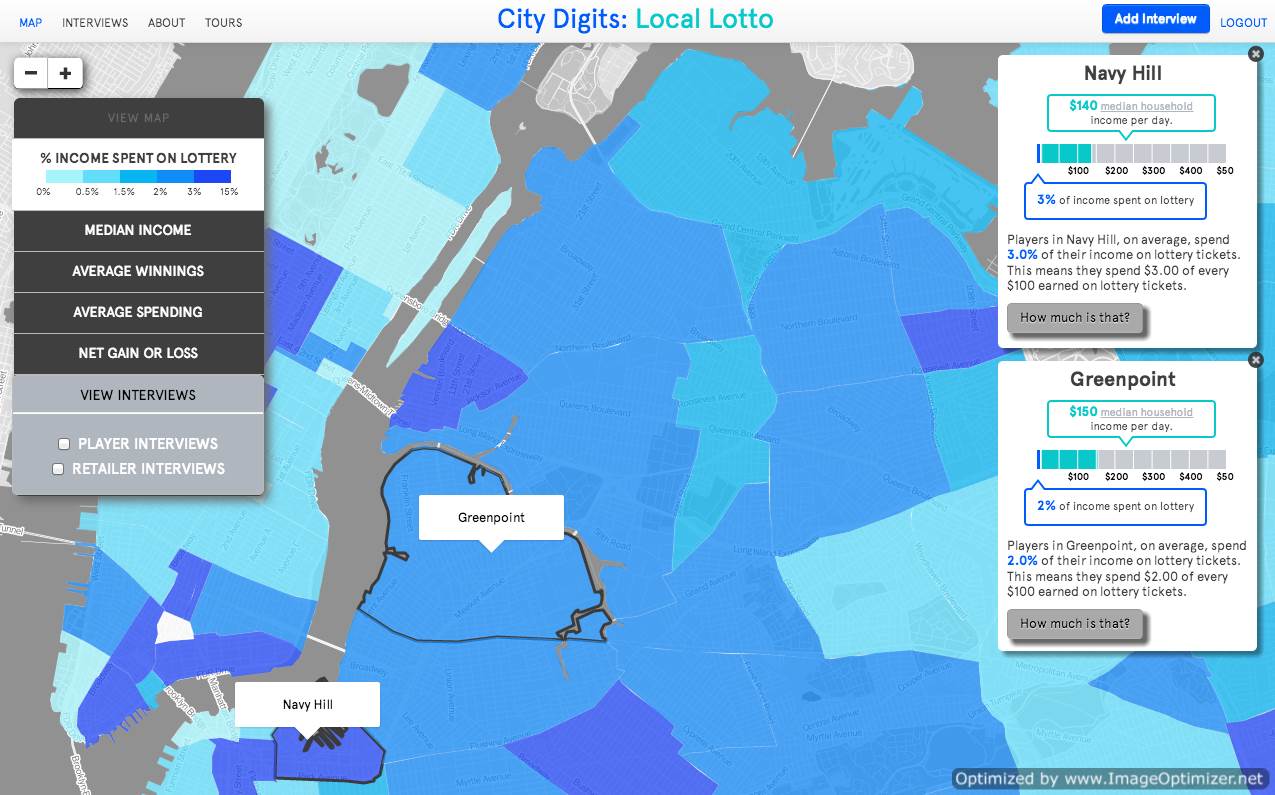 Students compare lottery spending to social demographics. This map shows the percentage of income spent on lottery per neighborhood.
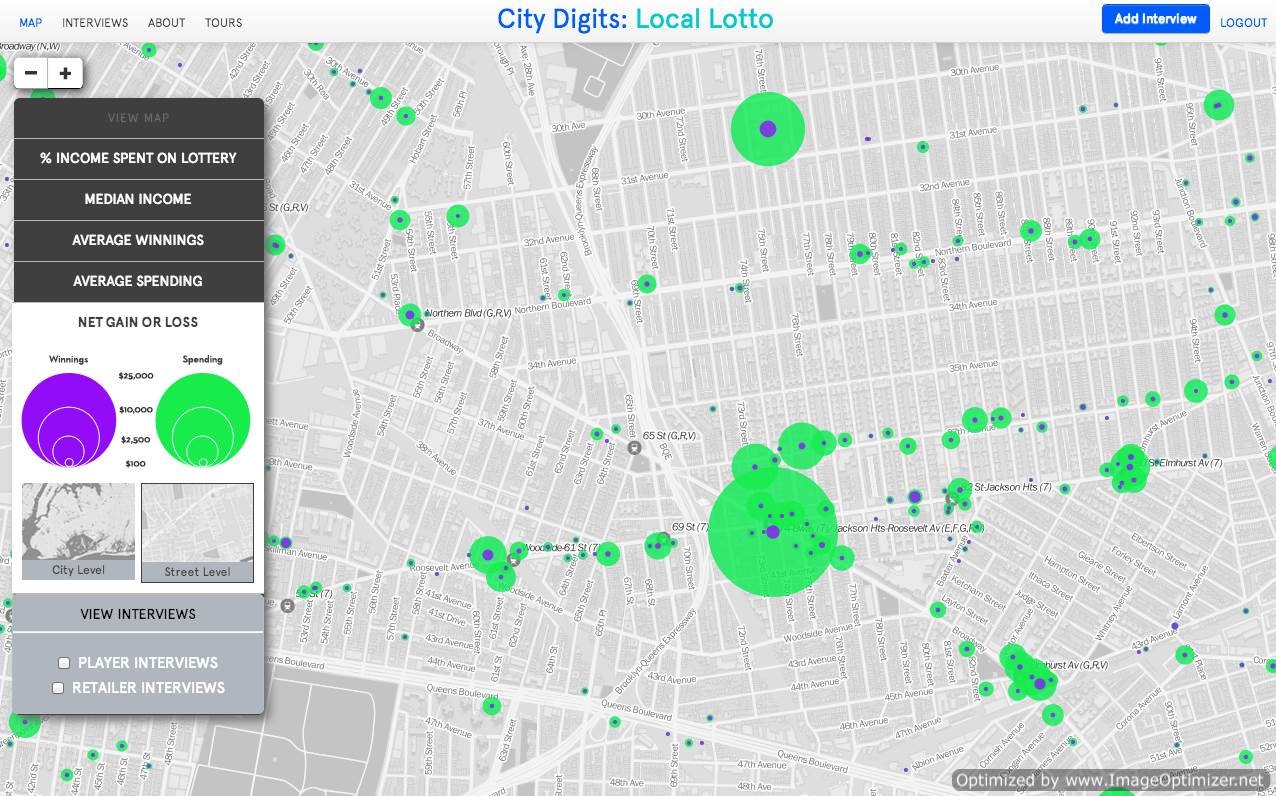
The map shows the odds of the lottery are slim, the green shows how much people spend on the lottery and the purple how much is won.
Students compare lottery spending to social demographics. This map shows the percentage of income spent on lottery per neighborhood.
The map shows the odds of the lottery are slim, the green shows how much people spend on the lottery and the purple how much is won.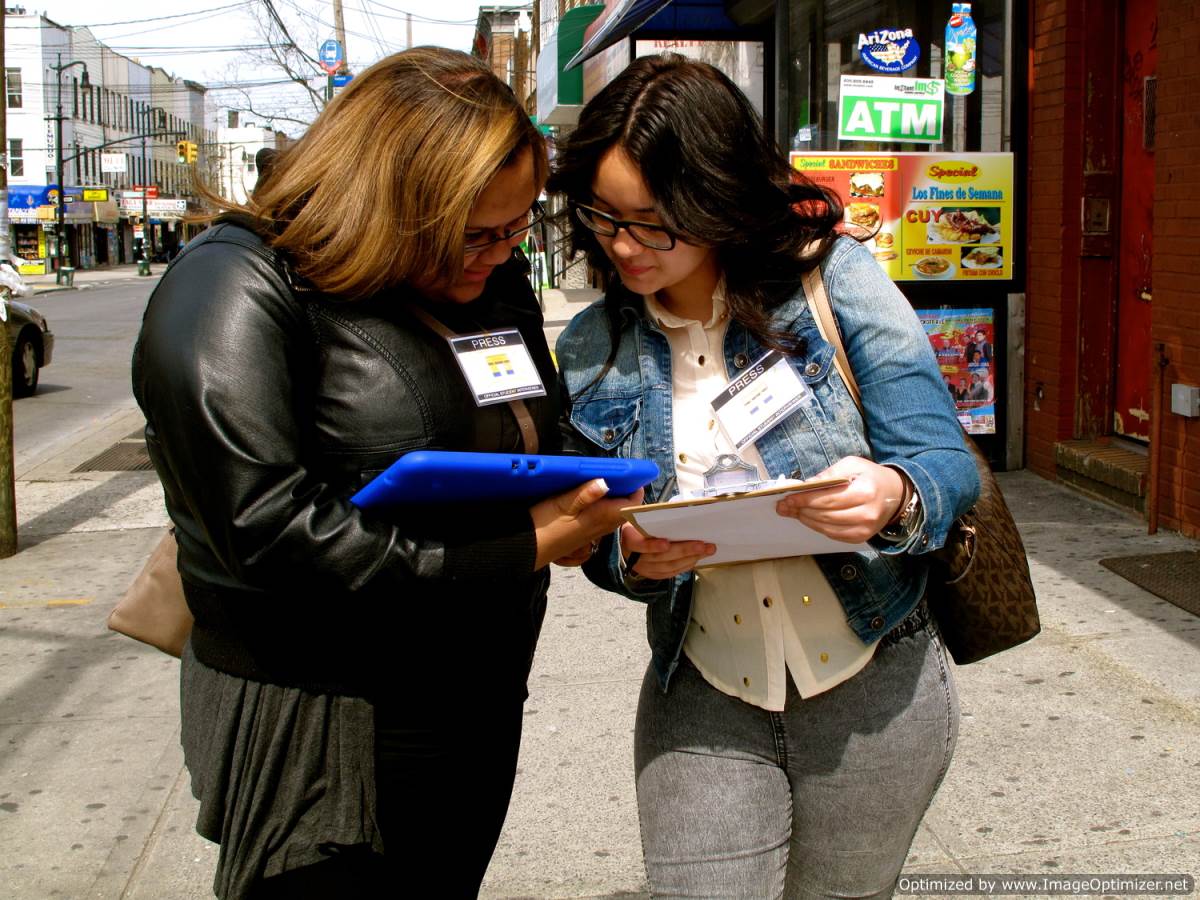 Students used tablets to find lottery retailers.
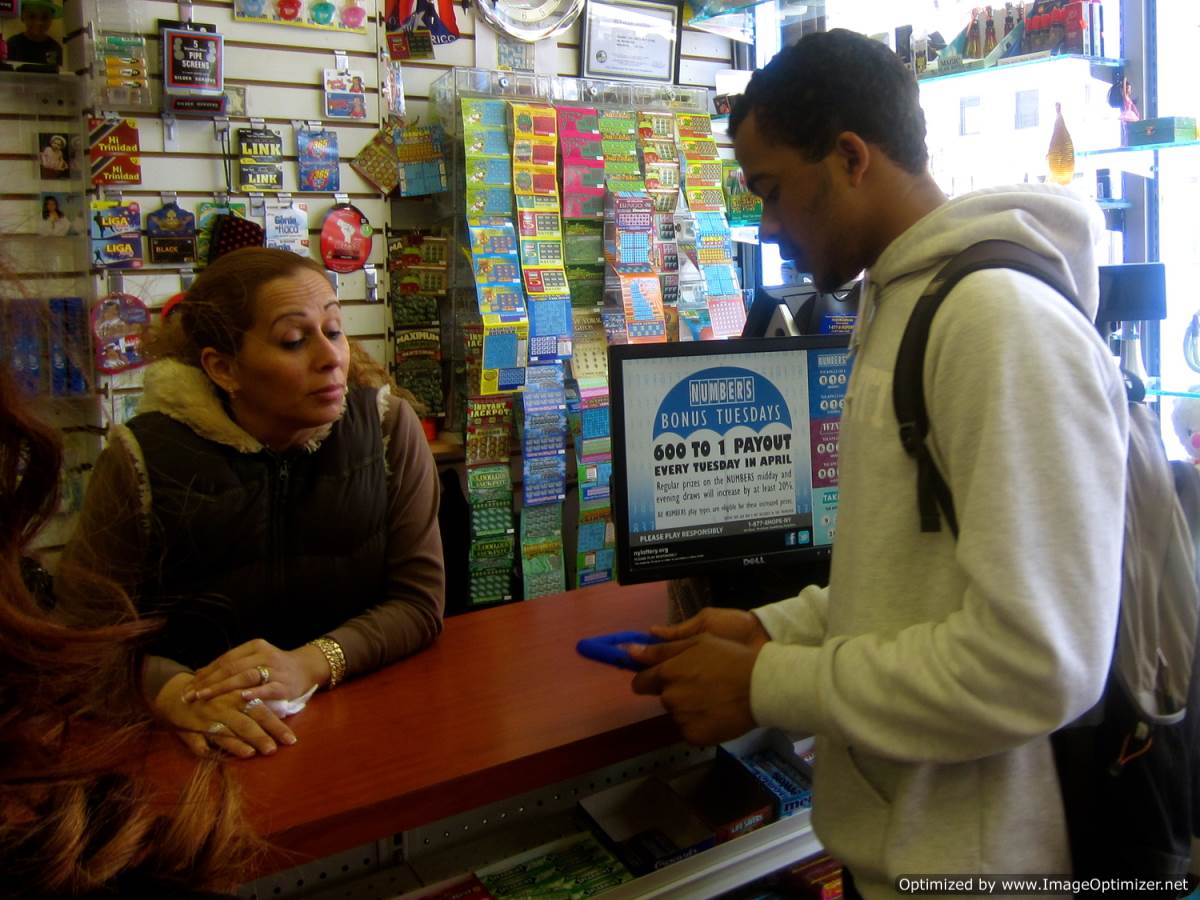 Lottery retailer were asked how much lottery tickets they sell on
an average day. They were also asked if they thought playing the
lottery is good or bad.
Lottery retailer were asked how much lottery tickets they sell on
an average day. They were also asked if they thought playing the
lottery is good or bad.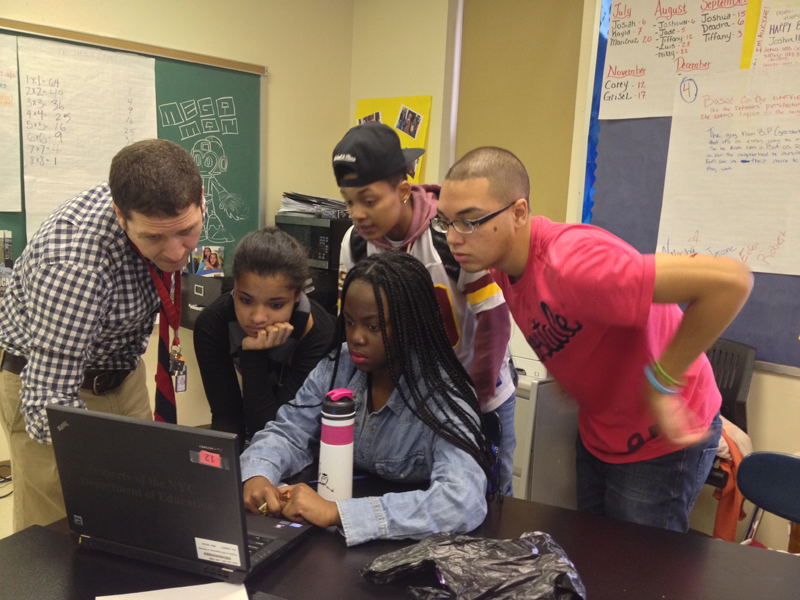 Students explored the maps in class.
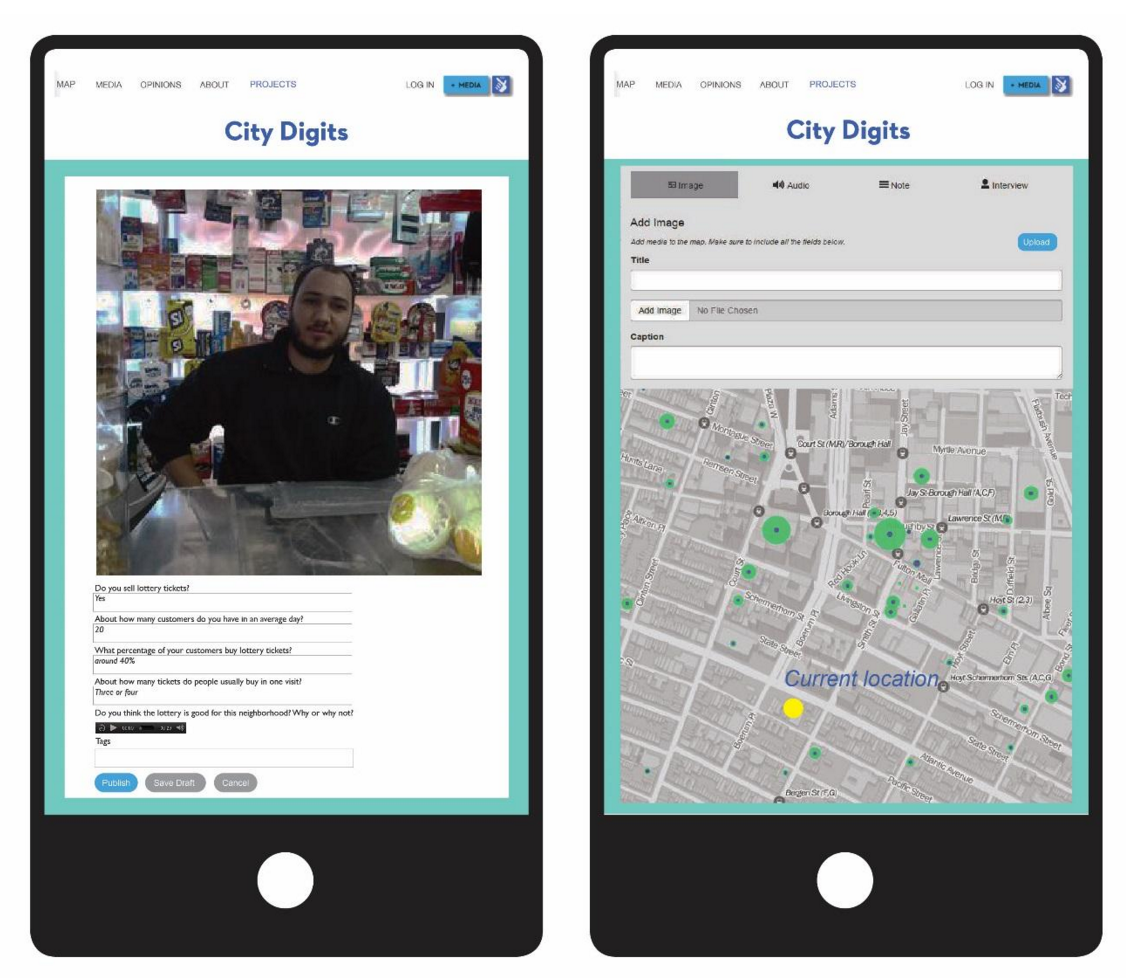 Students used tablets or smart phones to add the data they collected to the City Digits website.
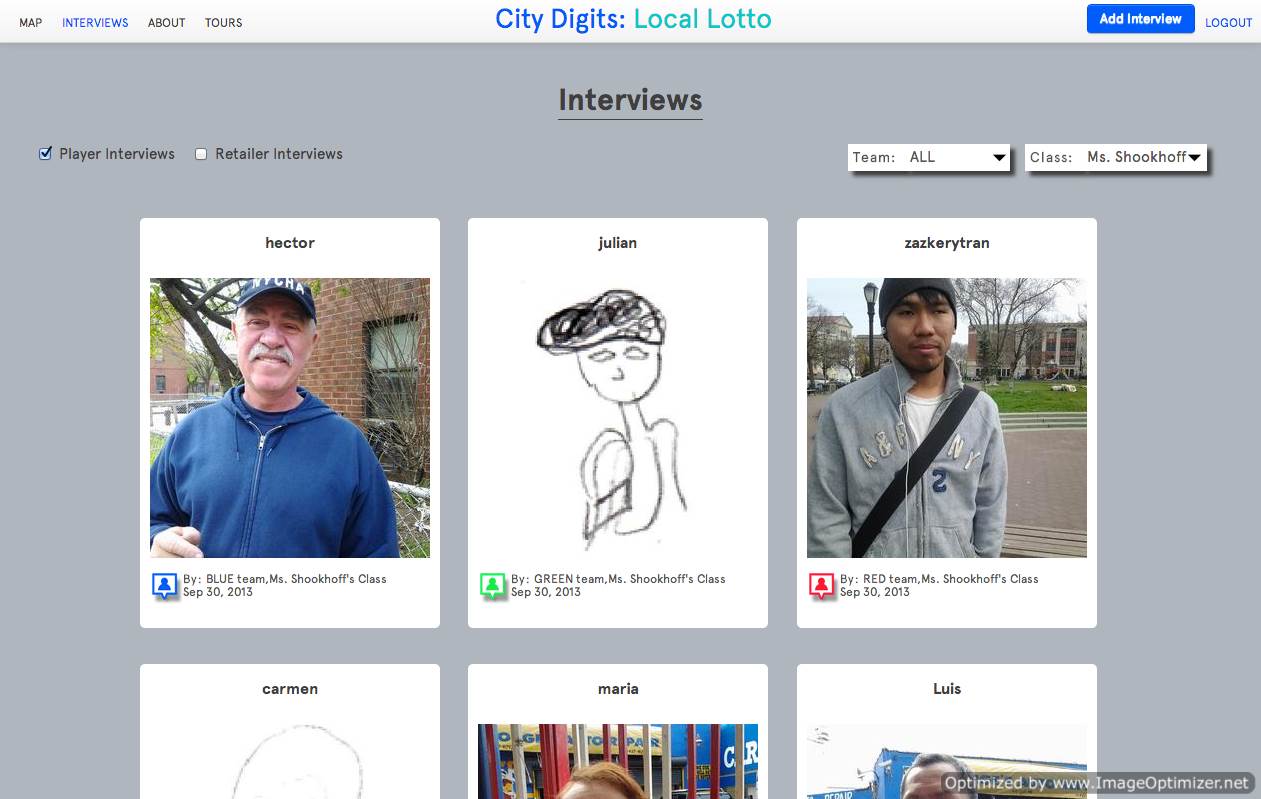
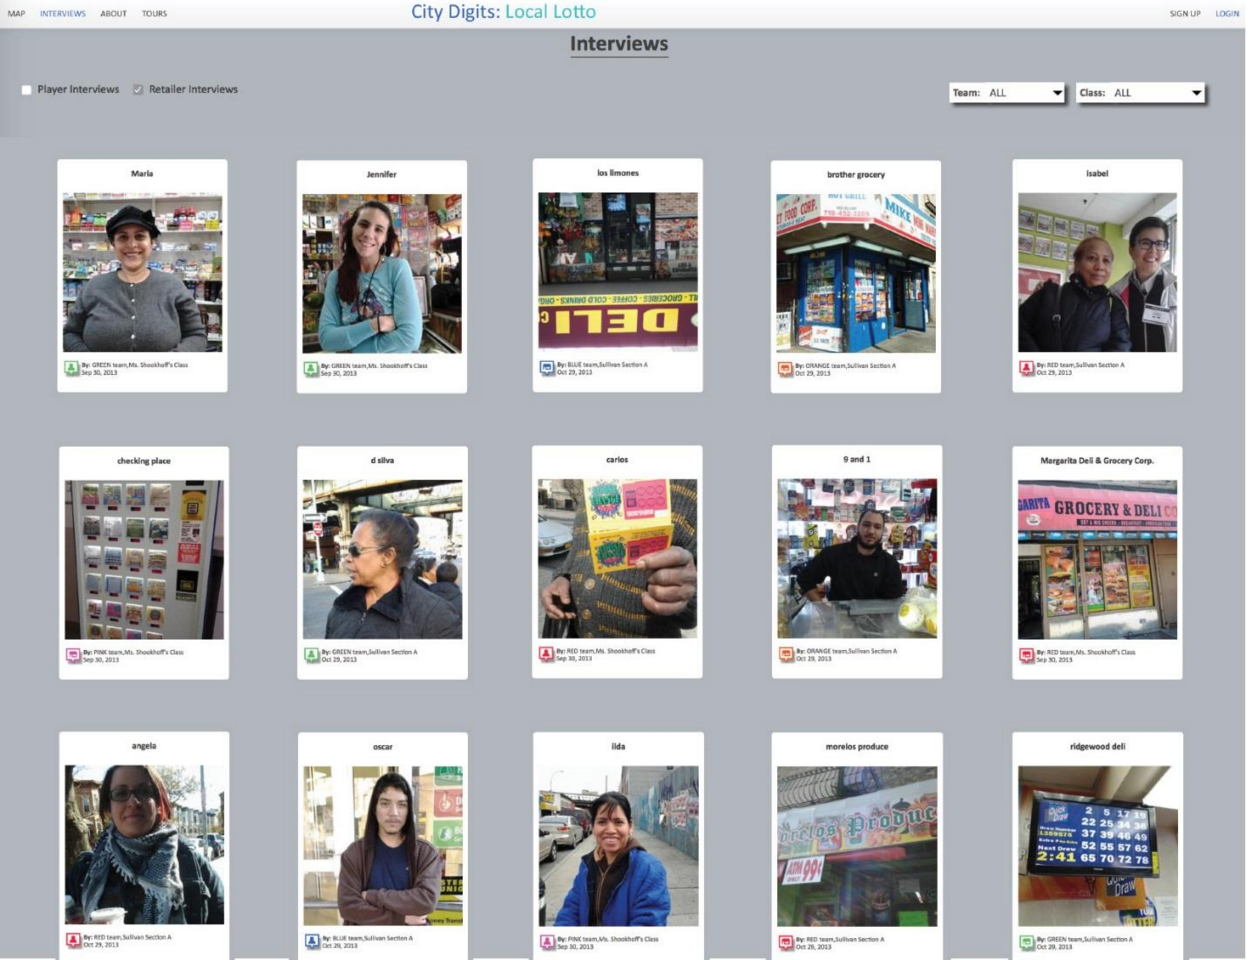 Interviews were added directly to the City Digits website, which allowed students to explore the qualitative data with quantitative data about the lottery. They used this data to develop arguments about whether the lottery was good or bad.
Active Learning
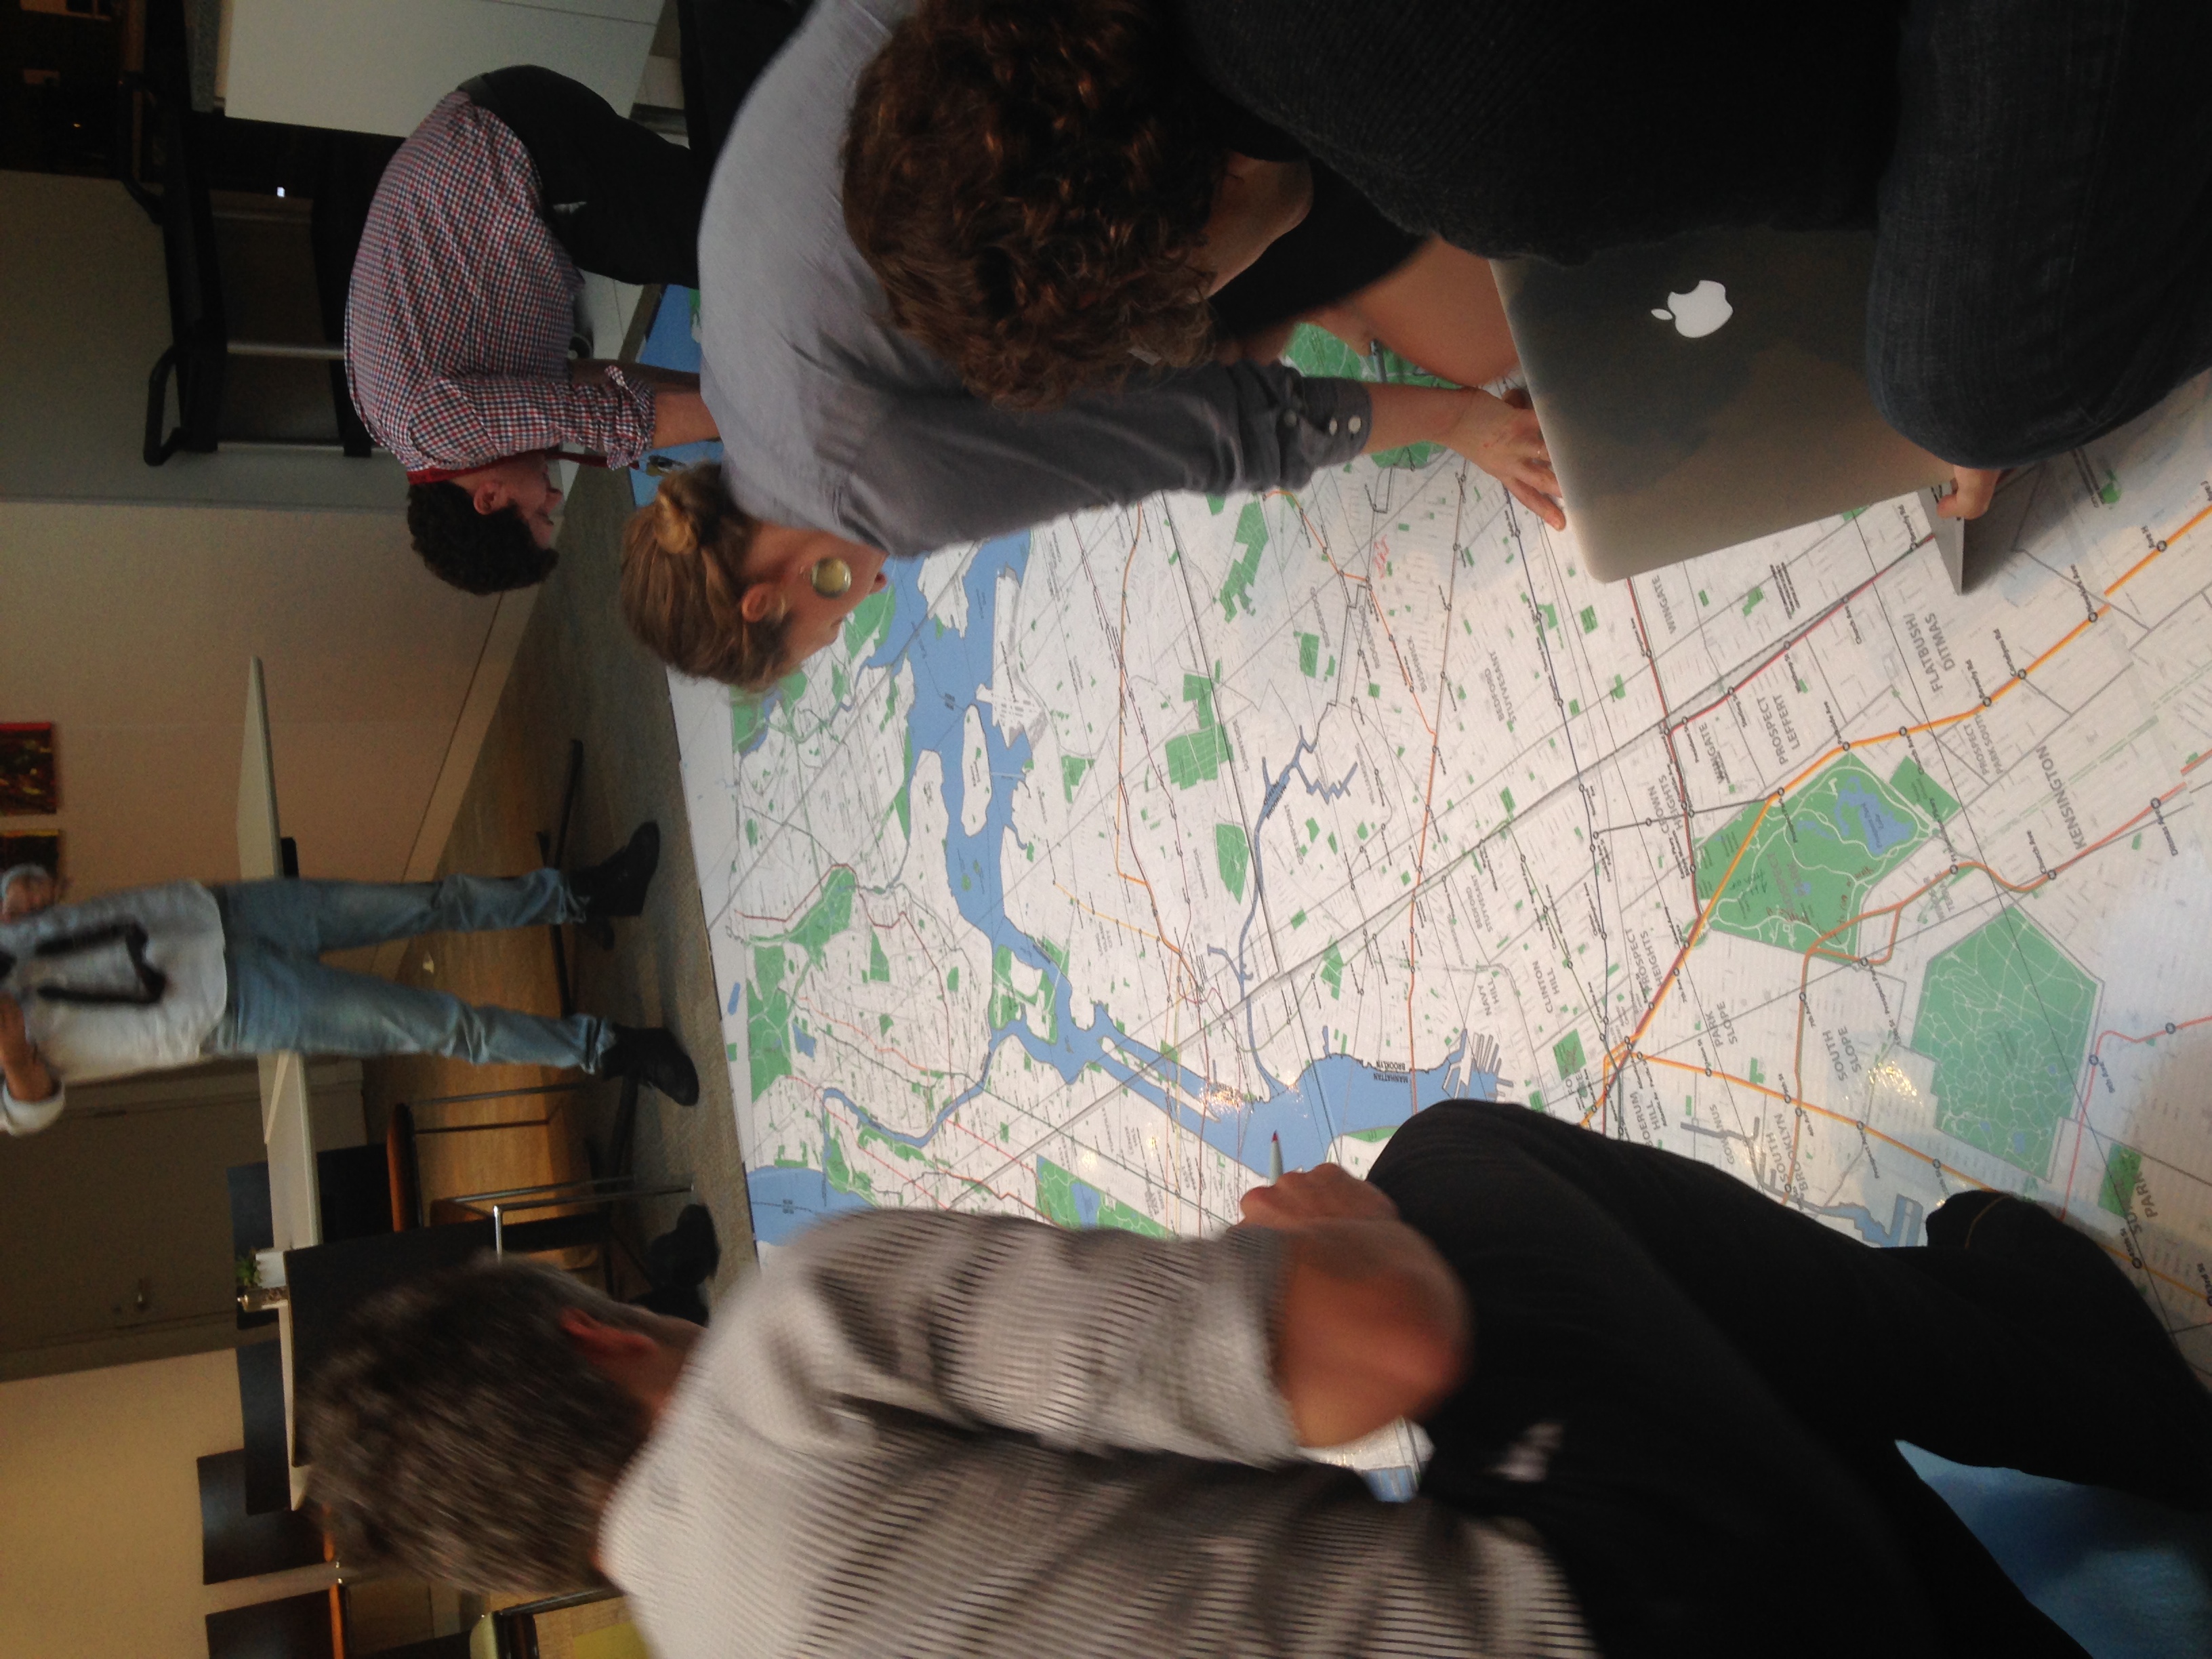
After the first release of the City Digits software, we found that students did not understand the geography of New York City. For the second release of the curriculum, a large scale map was used to allow students to explore New York City’s geography. Students added their home and were led through exercises which allowed them to investigate differences between the communities. Students also drew their maps to show the relationship between the lottery and their community. Students were also asked to take pictures of what the lottery looked like in the areas around the school.
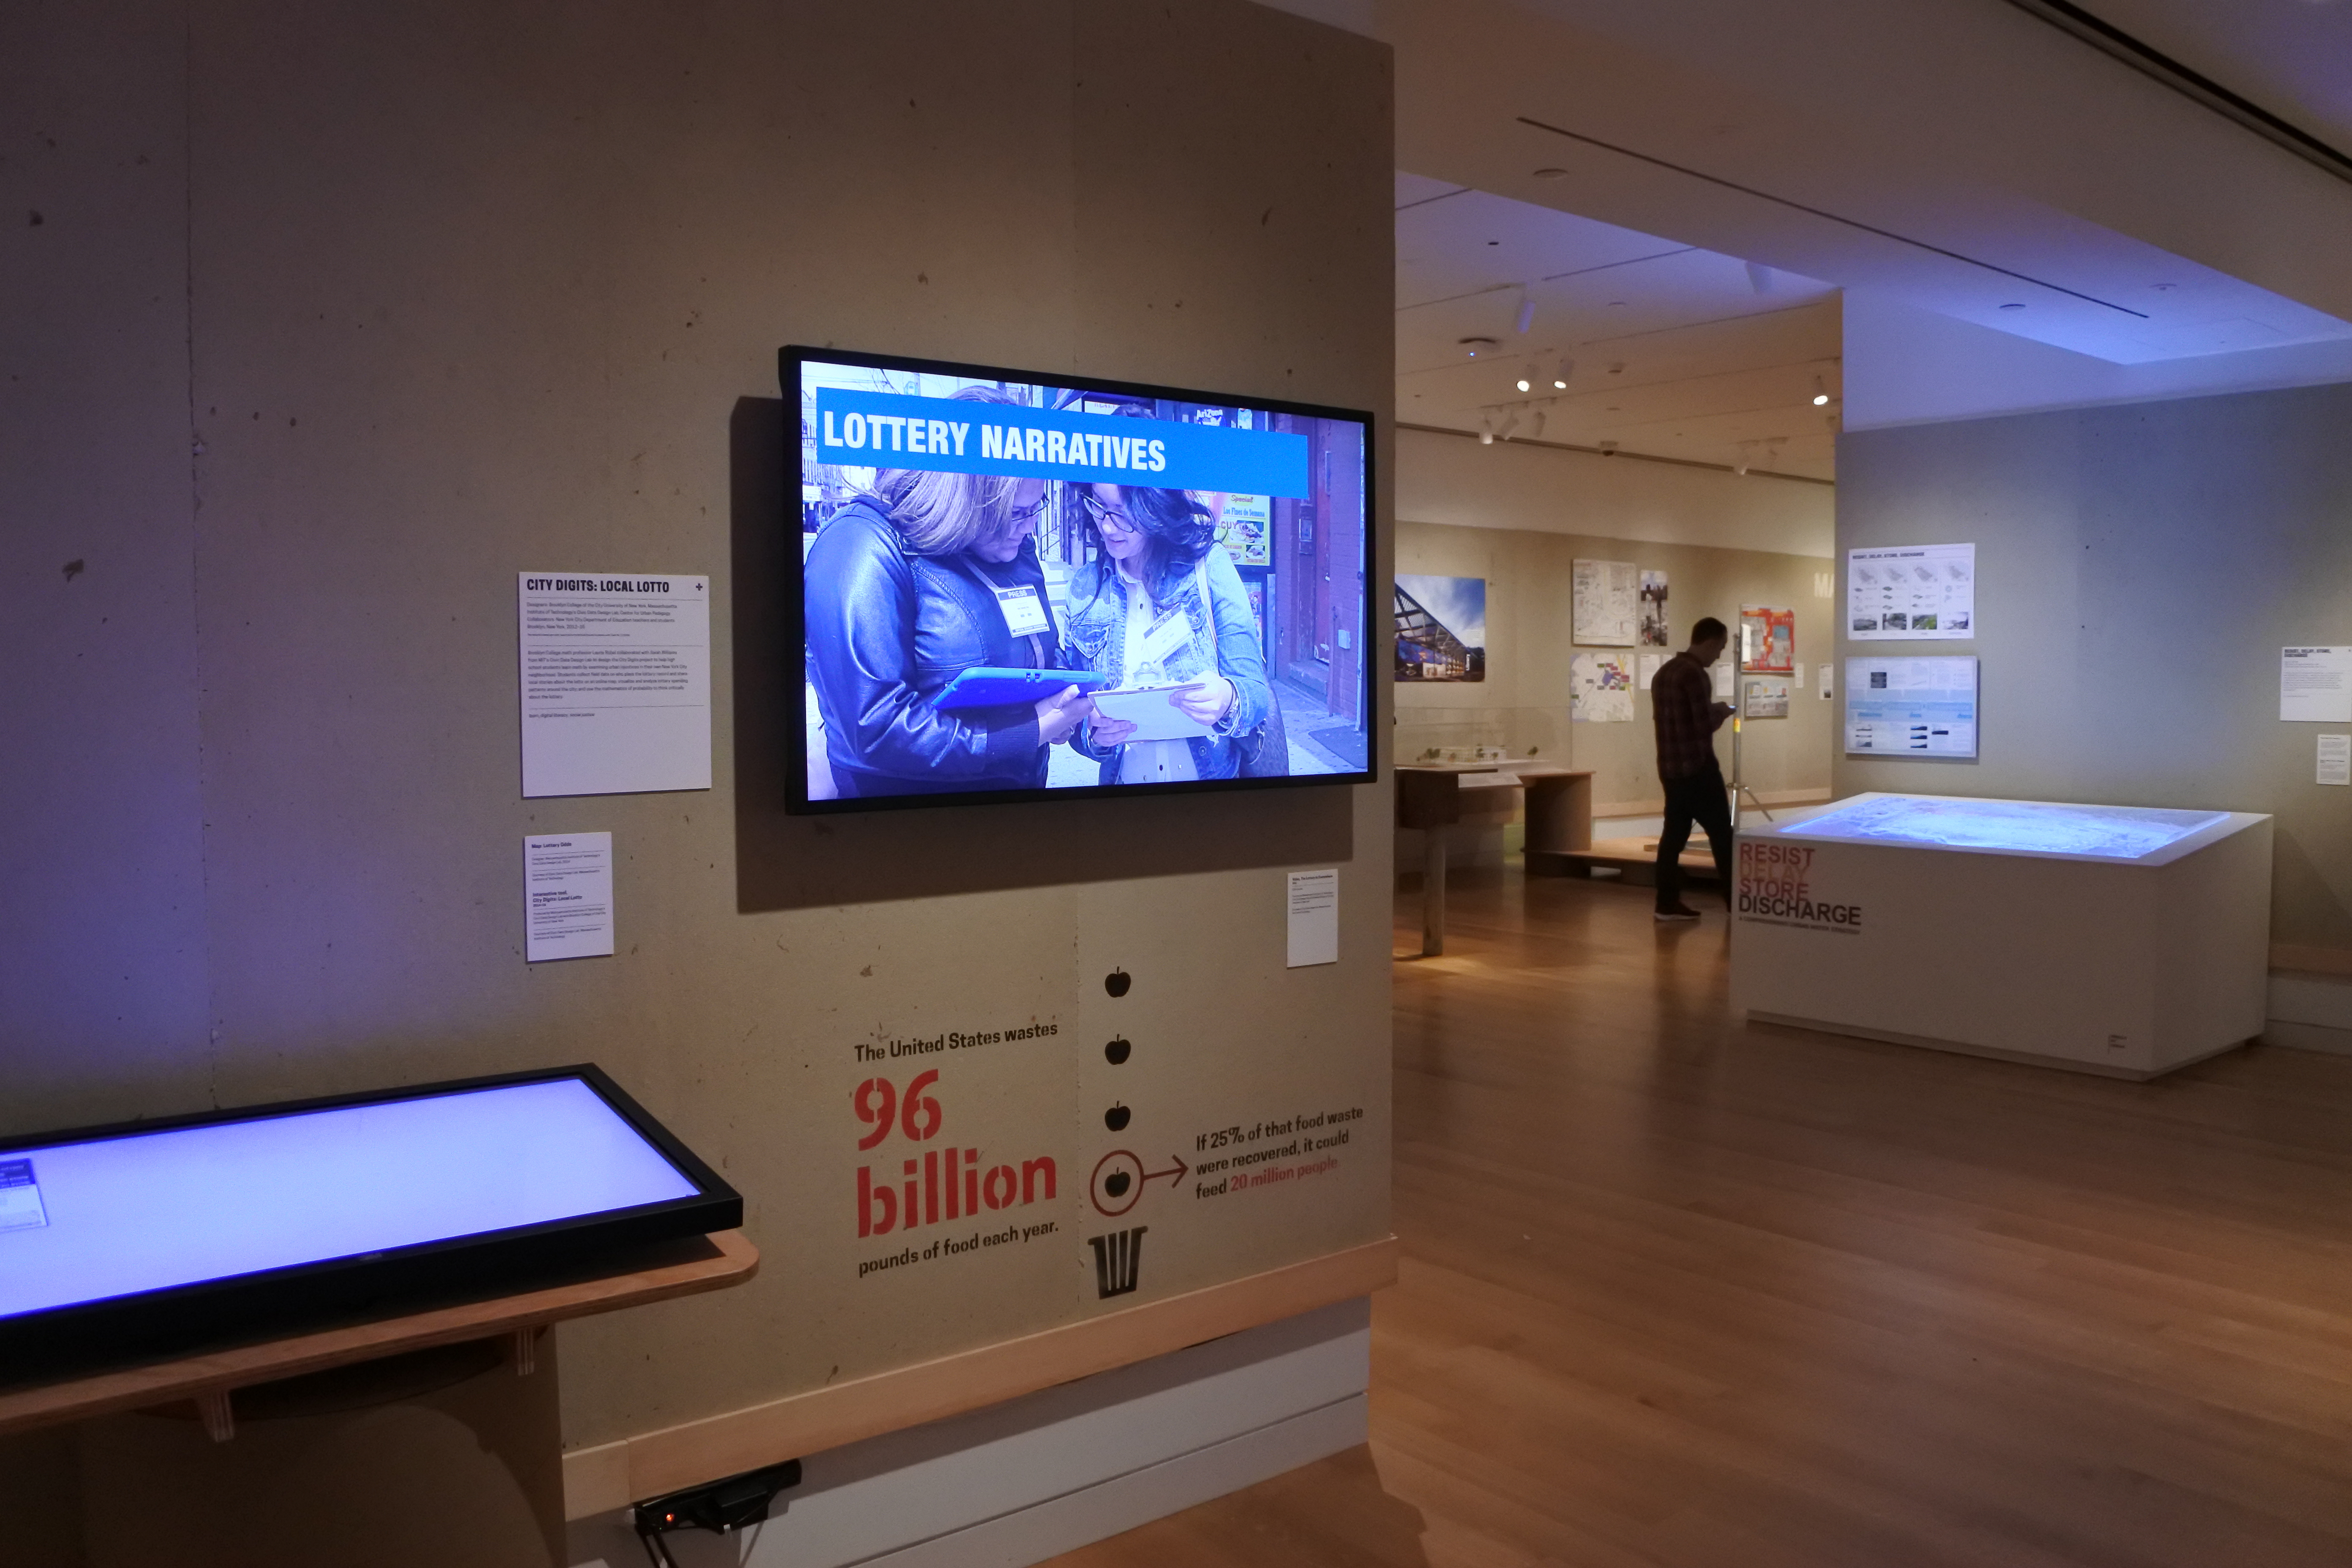 A movie about the City Digits curriculum was displayed in the Copper Hewitt museum in New York City. The exhibit also allowed patrons to use the tool in the museum. A large scale map showed if the lottery was good or bad.
Publications
Lim, Vivian, Laurie Rubel, Lauren Shookhoff, Mathew Sullivan, and Sarah Williams. “The Lottery is a Mathematics Powerball.” Mathematics Teaching in the Middle School, 21, no. 9 (2016): 526-53.
Williams, Sarah, Erica Deahl, Laurie Rubel, and Vivian
Lim. “City Digits: Developing Socially-Grounded Data Literacy Using Digital Tools.” Journal of Digital Media Literacy, (2014).
Lim, Vivian, Erica Deahl, Laurie Rubel, and Sarah Williams. “Local Lotto: Mathematics and Mobile.” Cases on Technology Integration in Mathematics Education, (2014): 43.
Press
“How Kids Are Learning Math, Maps and Spatial Justice in NYC.” MediaShift, July 2015
Workshops for Teachers
The Maps and Math of New York City Pawn Shops Mini-Course at Math for America, New York, NY, 2015.
CityDigits: Critical, Place- Based Approaches to Teaching & Learning Mathematics TODOS Conference. Phoenix, AZ, 2014.
LottaFacts: A Critical Analysis of the State Lottery Through Mathematics
Professional Development Workshop at Math for America. New York, NY, 2014.
LottaFacts: A Critical Analysis of the State Lottery Through Mathematics
Presentation at the Creating Balance for an Unjust World Conference. Los Angeles, CA, January 2014.
Exhibitions
City Digits, Cooper Hewitt Smithsonian Design Museum, New York, NY, 2016.
Making the City, AIGA/Annex South Street Seaport, New York, NY, 2015.
Mapping Brooklyn, BRIC House, Brooklyn NY, 2015.