The atlas of popular transport
2025
︎︎︎ Project Website
Norman B. Leventhal Center for Advanced Urbanism &
Civic Data Design Lab
Sarah Williams (Director)
Alberto Meouchi (Project Manager)
Maria Gabriela Carucci
Siemond Chan
Berit Lavender
Minwook Kang
Ilham Ali
︎︎︎Project Credit
︎︎︎ Project Website
Norman B. Leventhal Center for Advanced Urbanism &
Civic Data Design Lab
Sarah Williams (Director)
Alberto Meouchi (Project Manager)
Maria Gabriela Carucci
Siemond Chan
Berit Lavender
Minwook Kang
Ilham Ali
︎︎︎Project Credit
Overview


The Atlas of Popular Transport is a manifesto in collective intelligence—the convergence of human insight, technological tools, and the imagination to create data against all limitations. It shows that the knowledge to transform our cities already exists in the hands of those who move through them. It reminds us that the smartest cities are not necessarily the ones with the most sensors. They are the ones built through the hands of the collective vision of its inhabitants.
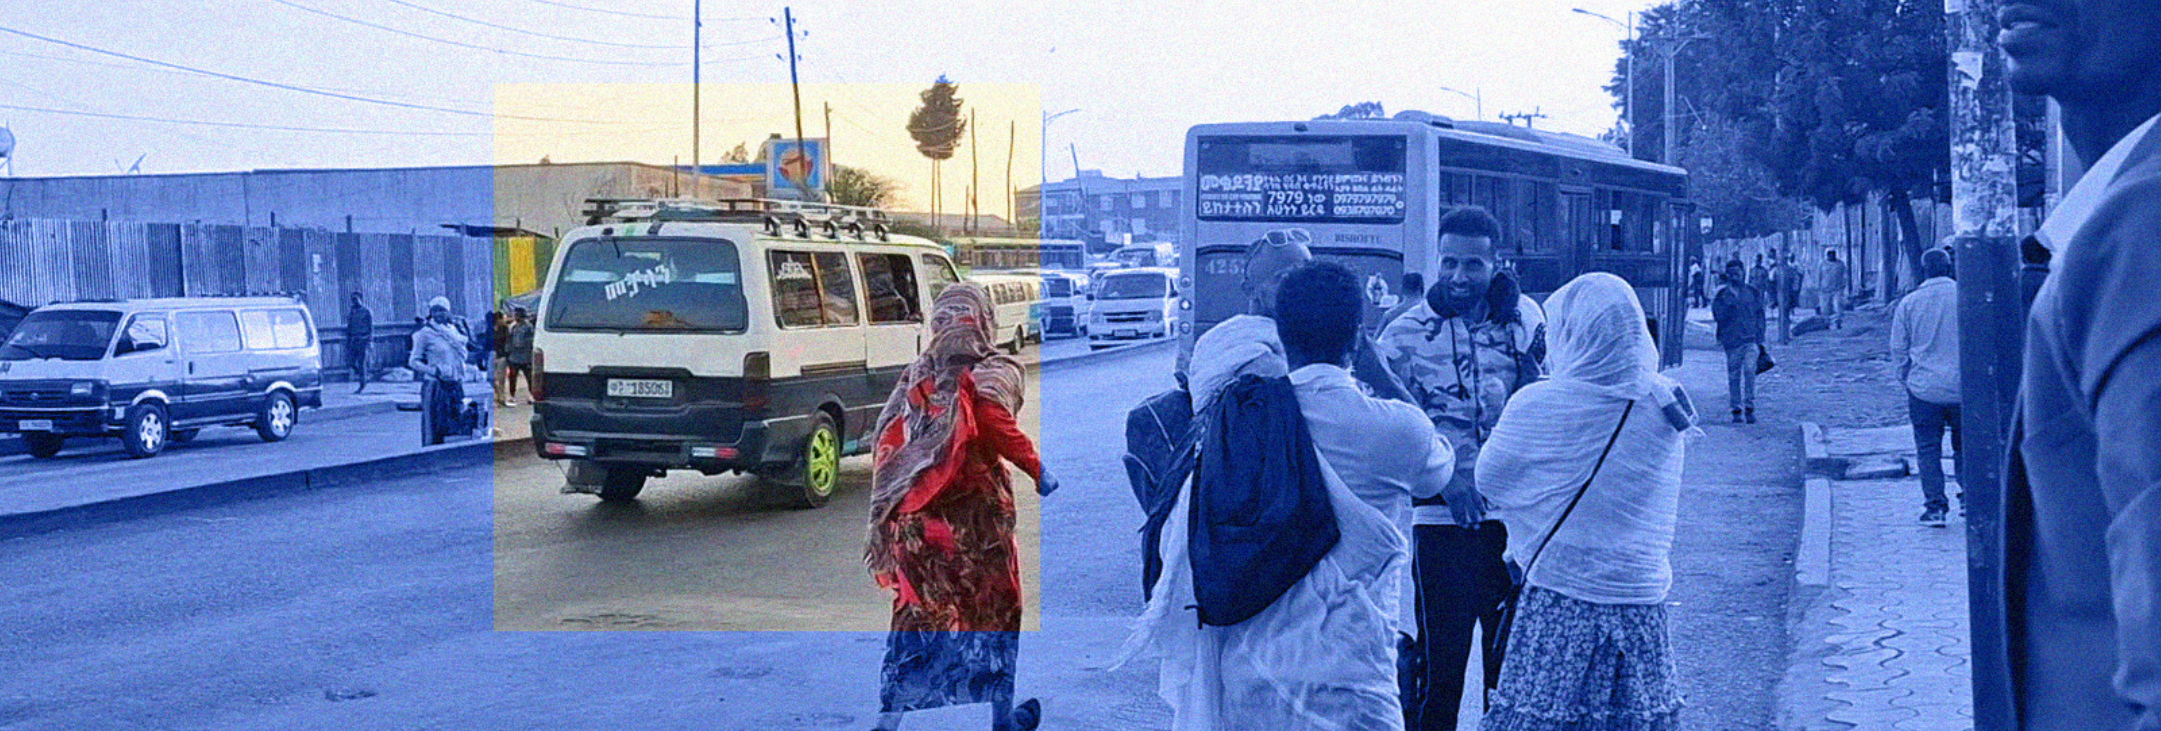
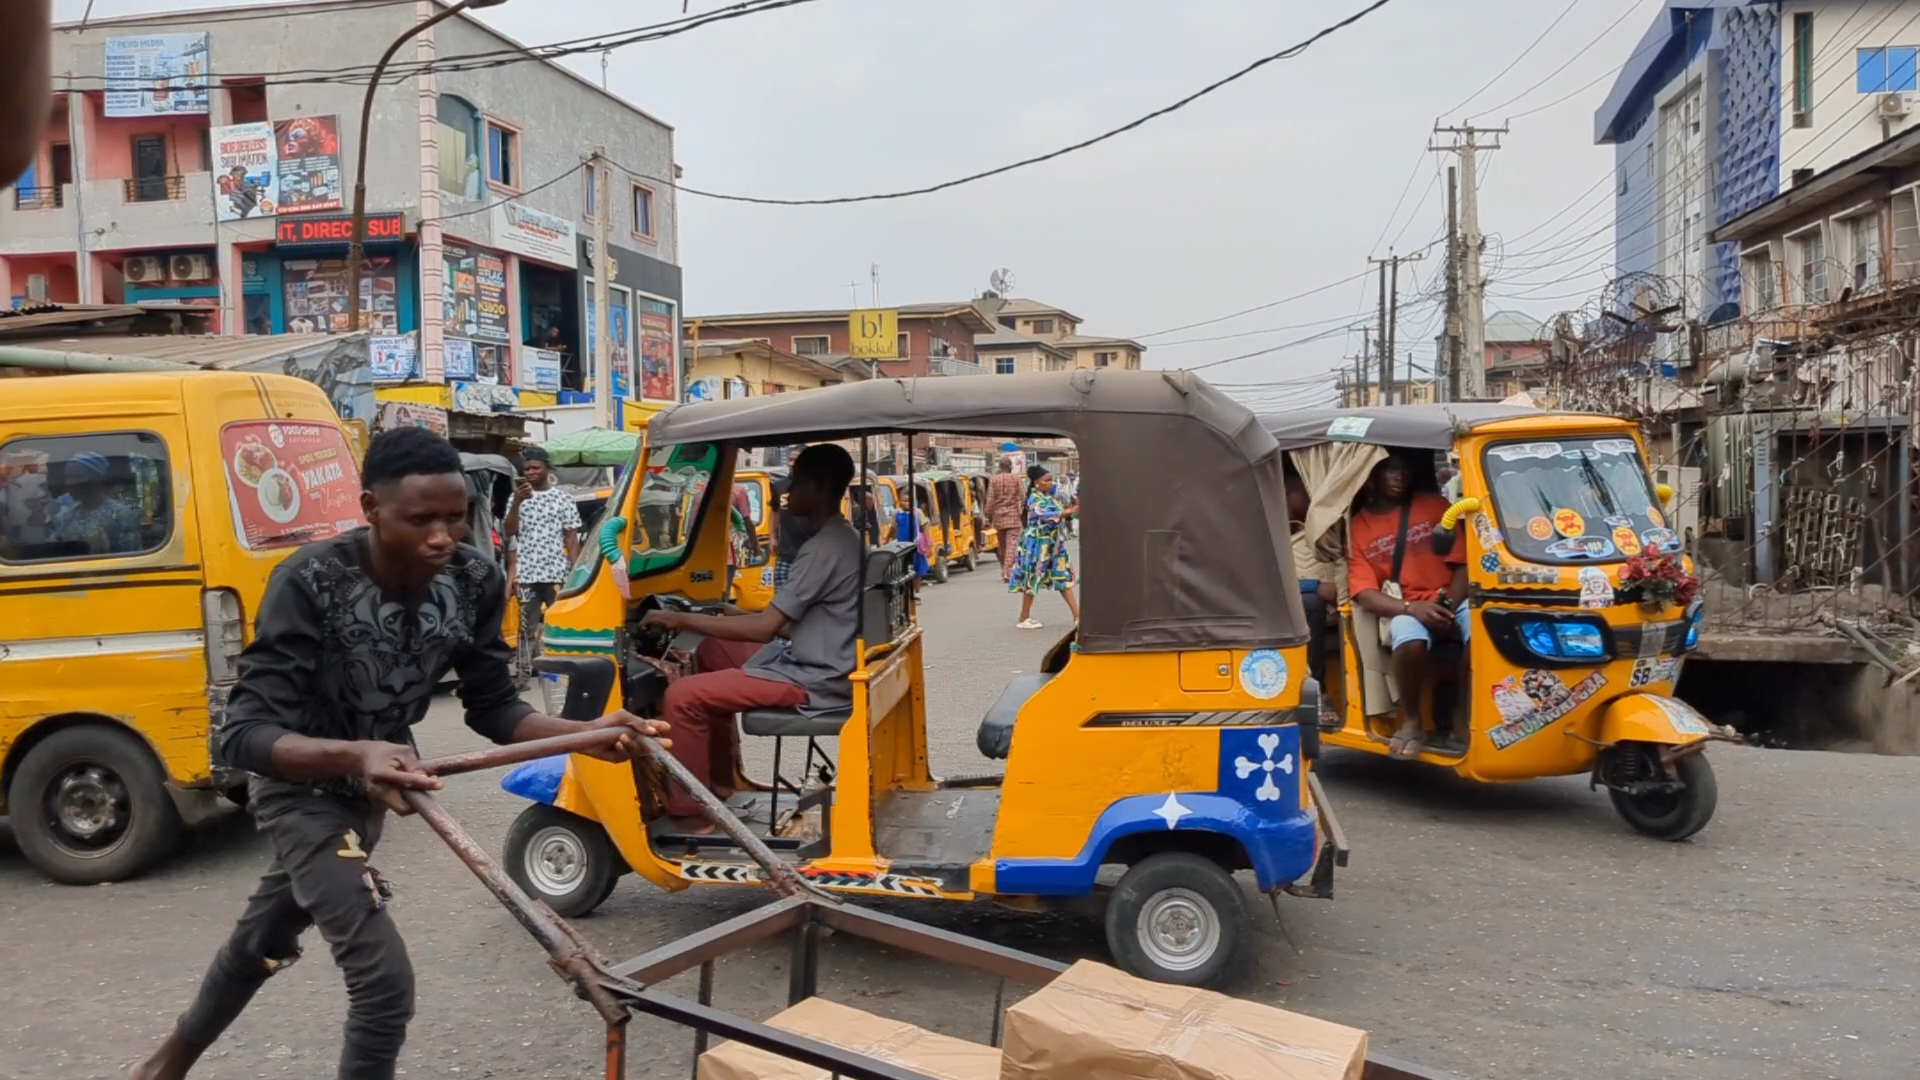
In most cities around the world, the daily commute begins not with a schedule, but with a question: Where does this bus go? For the billions who rely on popular transport systems—minibuses, tuk-tuks, shared vans, or repurposed school buses—that question is a daily leap of faith. These systems exist in nearly every city across the Global South, yet in most places, no official data exists—not even a map. As a result, navigating them requires constant negotiation, deep local knowledge, and often the help of other riders, drivers, or simply word of mouth.


COLLECTIVE INTELLIGENCE TRANSFORMED INTO DATA
The Atlas of Popular Transport shows what happens when that changes, illustrating how sixteen cities across Africa, Asia, and Latin America took advantage of a unique convergence of forces—the falling cost of smartphones, the rise of open-source tools like OpenStreetMap, and, most importantly, the determination of local actors who believed their cities deserved better and decided to develop data and maps of how their semi-formal, informal, or popular transport system operates to improve transport policy and provide greater access to these essential resources.
With GPS trackers and cell phones in their hands and deep knowledge of their streets, students, union leaders, civic hackers, artists, and riders mapped these popular transport systems that had long gone undocumented but served millions daily. Their efforts were not part of grand transportation overhauls or billion-dollar infrastructure projects. They were grassroots, volunteer-powered, low-tech, and wildly ambitious. From the buzzing jeepneys of Manila to the music-blasting matatus of Nairobi, the overstuffed yellow danfos of Lagos, and Cairo’s ever-present microbuses, each project represented a quiet revolution: the decision to map what already exists—and the belief that making it visible could transform how cities move.
EXHIBITION AND ATLAS

What you’ll see in this Atlas of Popular Transport, both the exhibition and these pages, are the outputs of that work: GTFS data projected on screens; paper maps tucked in drawers that, when pulled out, activate immersive video experiences that place you on the streets of each city. The installation invites you to feel what it’s like to ride these buses, to be part of these places, and to move through systems designed by the people who use them everyday.
INSPIRATION STARTS IN NAIROBI
Many of the cities featured in this Atlas were directly inspired by the Digital Matatus project in Nairobi, or became part of the global network it helped catalyze. That early effort laid the foundation for broader initiatives like Digital Transport for Africa, the Datum project in Latin America, and the Global Network for Popular Transportation (GNPT)— platforms that now provide resources and advocate for the development and use of informal transport data around the world.

Launched in 2012, Digital Matatus showed that with mobile phones and local partnerships, a small team could collect and structure popular transport data using the global GTFS standard, integrate it into platforms like Google Maps, and co-create a paper map through workshops with drivers, operators, government officials, and the public. The project made the system visible—for the first time—as one unified network that could be planned for and help people across Nairobi make better decisions about their daily mobility. More than just a mapping data, Digital Matatus became a model: a methodology for community-driven data collection that has since inspired efforts in Accra, Addis Ababa, Amman, Bogotá, and beyond.
TRANSPORT DATA WITH A POLICY IMPACT

While the Atlas does not represent every mapping effort worldwide, it offers a compelling cross-section of projects initiated for diverse reasons—some to fill policy gaps, others to support grassroots organizing, sustainability, or gender inclusion. All were shaped by the lived experiences of local actors, whose voices are captured through the interviews that form the foundation of this Atlas. Our team wanted these groups to tell their stories from their own perspectives— showing how they overcame challenges to build something meaningful for their communities.
The results were tangible. In Cape Town, the data helped guide COVID-19 policy. In Cairo, it informed electric vehicle corridor planning. In Bogotá, it sparked new thinking about how informal systems can connect to formal transit, offering last-mile solutions to the city’s lowest-income neighborhoods. In every city, the public gained something previously unavailable: a way to make informed decisions about how to move through their city increasing accessibility to transit for everyone.
GENDER EQUITY IN POPULAR TRANSPORT
Gender equity emerged as a central focus for most of the projects. Women are among the most frequent users of informal transit—often depending on it for caregiving, work, and daily errands—yet they face disproportionate risks and limited access. Many mapping teams made intentional efforts to address this. In Cochabamba, mappers worked with women to document their experiences and needs, integrating their feedback into the map. In Amman, students analyzed how women’s mobility is shaped by the system. In Santiago de los Caballeros, teams collaborated with women’s organizations to improve safety. In Beirut, the project opened broader conversations about gender and the right to the city. And in Cairo, women were included in the mapping process itself—despite social resistance—ensuring that the data reflected a fuller range of lived realities. These maps did more than visualize transport—they helped make cities more inclusive.

Popular transport systems are managed not by transit agencies, but by associations, unions, or cooperatives—like the saccos (Savings and Credit Cooperative Organizations) in Kenya. These groups play a vital role in organizing routes, managing operations, and keeping some form of order in systems that operate without central oversight. Their influence varies by context, but in places like Nairobi, Managua, and Cochabamba, working with these unions was essential to collecting data and navigating the political terrain of informality. Any serious effort to reform or integrate these systems must engage with these local institutions, which are deeply embedded in the governance of urban mobility.
GTFS DATA TURNS DATA INTO TOOLS
The cities produced their data in GTFS format—the General Transit Feed Specification. Originally created by Google and TriMet in Portland Oregon to integrate transit info into Google Maps, GTFS has since become a global standard. It transforms locally collected data—routes, stops, schedules—into a format that can be used by trip planners like Google Maps, Trufi, and Moovit, or for tools that analyze transit equity and accessibility. For many teams, adopting GTFS made their work instantly more usable, shareable, and impactful—turning grassroots mapping efforts into platforms for navigation, planning, advocacy, and collective action.
Open data is essential
This Atlas highlights several encouraging examples where multilateral institutions have taken an open and collaborative approach. In a number of cities, they worked directly with local mappers, supported open data initiatives, and helped foster transparency and innovation in the transport sector. These cases demonstrate the powerful potential of aligning institutional capacity with grassroots energy—a model of collaboration that values both technical expertise and lived experience.
At the same time, challenges remain. In some contexts, data collected by government entities are not always made public or accessible to local communities—limiting its impact on those who rely most on the systems it describes. And while the projects featured in this Atlas succeeded in creating transformative datasets, many remain underfunded and struggle to sustain their efforts once the initial mapping is complete. Without long-term investment in data maintenance, local capacity, and public access, the full potential of this work risks being lost just as it begins to gain traction.
POPULAR TRANSPORT MOVES THE MAJORITY OF PEOPLE IN THE WORLD
The Atlas documents transport systems that move the majority of people in many of the world’s fastest-growing cities. By mapping them, communities didn’t just document how people move—they created new ways to understand, navigate, and improve the cities they call home.
Awards
︎︎︎MAB 25 nominated. 2025 Media Architecture Biennale, Bangkok, Thailand, Oct 7, 2025.
Press
︎︎︎ “Venice Architecture Biennale 2025: Best Design Projects.” Elle Decor, August 1, 2025.
︎︎︎ “LCAU and Civic Data Design Lab to debut Atlas of Popular Transport in Venice.” bdnews24.com, May 8, 2025.
︎︎︎MAB 25 nominated. 2025 Media Architecture Biennale, Bangkok, Thailand, Oct 7, 2025.
Press
︎︎︎ “Venice Architecture Biennale 2025: Best Design Projects.” Elle Decor, August 1, 2025.
︎︎︎ “LCAU and Civic Data Design Lab to debut Atlas of Popular Transport in Venice.” bdnews24.com, May 8, 2025.